
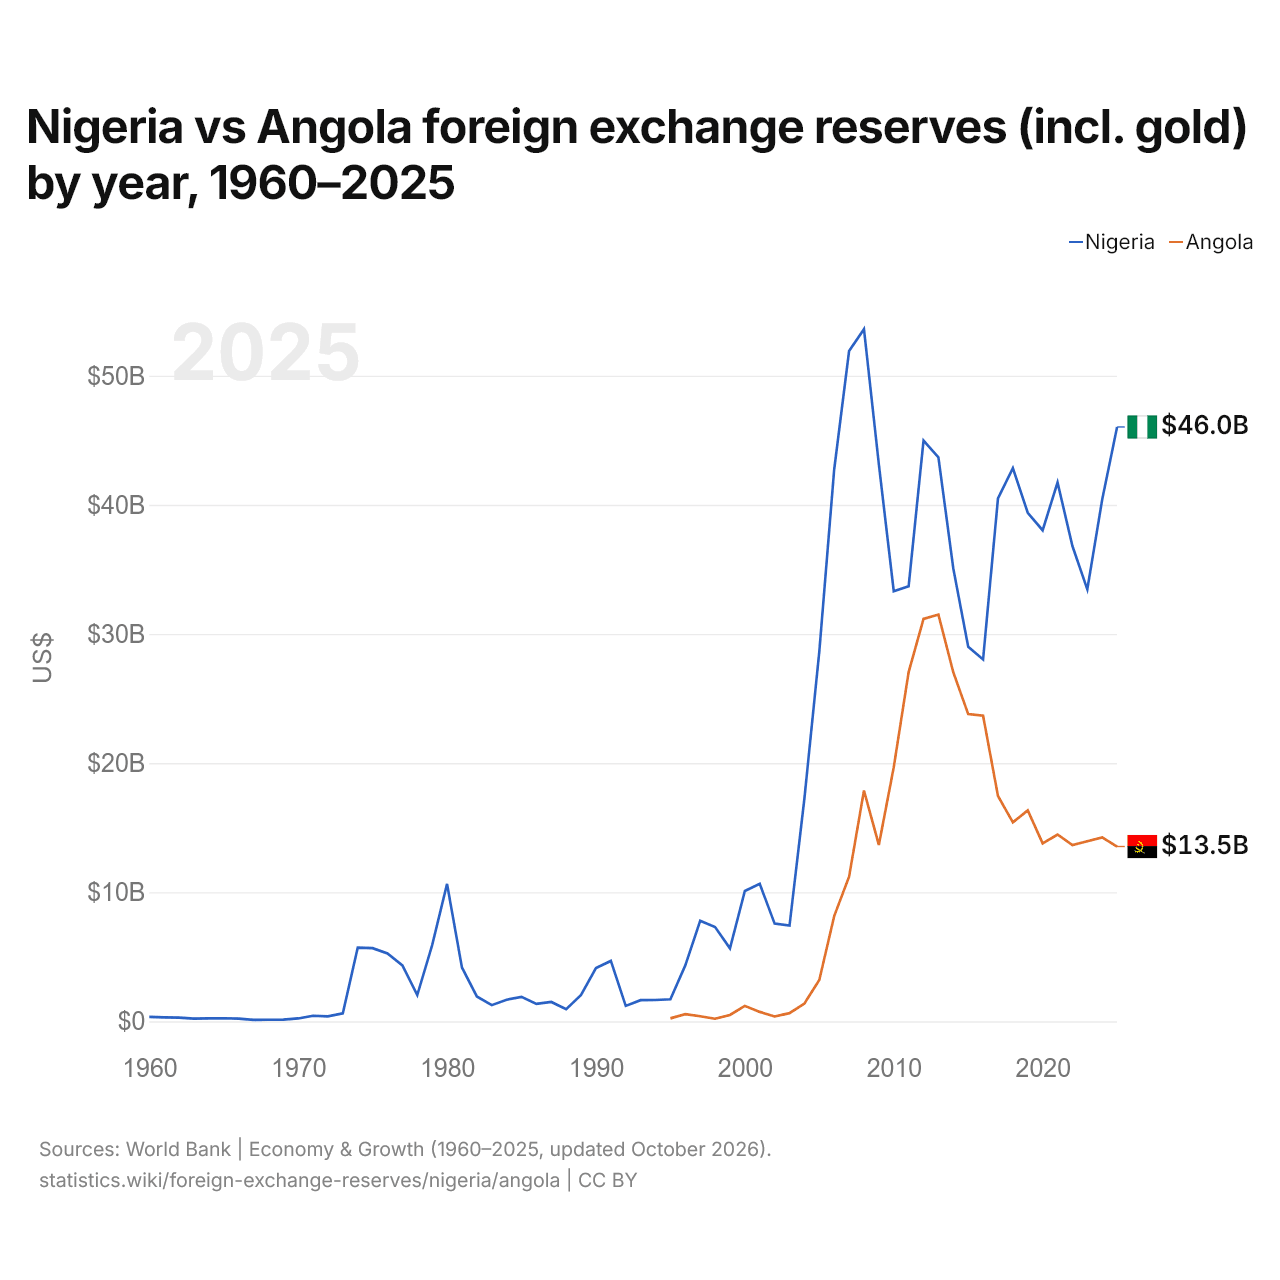
Nigeria vs Angola : réserves de change (or compris) par année, 1960–2025
| Année | $ US | |
|---|---|---|
 Nigeria |
 Angola |
|
| 2025 | 46 024 916 767 $ US | 13 536 065 182 $ US |
| 2024 | 40 405 994 025 $ US | 14 242 892 505 $ US |
| 2023 | 33 452 495 122 $ US | 13 942 114 199 $ US |
| 2022 | 36 809 762 970 $ US | 13 654 715 740 $ US |
| 2021 | 41 727 503 547 $ US | 14 468 113 826 $ US |
| 2020 | 38 028 751 518 $ US | 13 781 988 140 $ US |
| 2019 | 39 382 191 479 $ US | 16 334 853 784 $ US |
| 2018 | 42 838 869 125 $ US | 15 410 405 365 $ US |
| 2017 | 40 499 220 796 $ US | 17 455 327 771 $ US |
| 2016 | 28 020 197 619 $ US | 23 672 191 989 $ US |
| 2015 | 29 011 450 144 $ US | 23 790 543 425 $ US |
| 2014 | 35 070 259 874 $ US | 27 032 344 084 $ US |
| 2013 | 43 675 023 638 $ US | 31 500 815 462 $ US |
| 2012 | 44 973 806 132 $ US | 31 161 778 889 $ US |
| 2011 | 33 691 784 436 $ US | 27 039 761 554 $ US |
| 2010 | 33 305 051 216 $ US | 19 678 661 657 $ US |
| 2009 | 43 129 830 238 $ US | 13 664 098 154 $ US |
| 2008 | 53 598 093 557 $ US | 17 869 411 576 $ US |
| 2007 | 51 906 164 586 $ US | 11 196 800 894 $ US |
| 2006 | 42 735 039 033 $ US | 8 149 079 646 $ US |
| 2005 | 28 632 051 717 $ US | 3 196 850 749 $ US |
| 2004 | 17 256 543 969 $ US | 1 379 588 147 $ US |
| 2003 | 7 415 087 386 $ US | 634 199 422 $ US |
| 2002 | 7 566 806 239 $ US | 375 545 950 $ US |
| 2001 | 10 646 598 366 $ US | 731 866 198 $ US |
| 2000 | 10 099 448 198 $ US | 1 198 212 373 $ US |
| 1999 | 5 649 725 441 $ US | 491 400 190 $ US |
| 1998 | 7 298 545 693 $ US | 202 442 614 $ US |
| 1997 | 7 781 250 309 $ US | 392 514 286 $ US |
| 1996 | 4 329 391 828 $ US | 555 691 254 $ US |
| 1995 | 1 709 113 521 $ US | 228 335 521 $ US |
| 1994 | 1 649 172 399 $ US | - |
| 1993 | 1 640 443 739 $ US | - |
| 1992 | 1 196 052 750 $ US | - |
| 1991 | 4 678 023 330 $ US | - |
| 1990 | 4 128 789 618 $ US | - |
| 1989 | 2 041 078 374 $ US | - |
| 1988 | 932 989 777 $ US | - |
| 1987 | 1 497 832 059 $ US | - |
| 1986 | 1 349 903 027 $ US | - |
| 1985 | 1 891 868 244 $ US | - |
| 1984 | 1 674 113 905 $ US | - |
| 1983 | 1 251 986 799 $ US | - |
| 1982 | 1 926 433 779 $ US | - |
| 1981 | 4 168 449 636 $ US | - |
| 1980 | 10 639 786 873 $ US | - |
| 1979 | 5 899 642 026 $ US | - |
| 1978 | 2 028 808 604 $ US | - |
| 1977 | 4 335 987 601 $ US | - |
| 1976 | 5 256 784 369 $ US | - |
| 1975 | 5 665 692 312 $ US | - |
| 1974 | 5 708 969 927 $ US | - |
| 1973 | 622 853 179 $ US | - |
| 1972 | 390 711 739 $ US | - |
| 1971 | 431 942 651 $ US | - |
| 1970 | 223 498 270 $ US | - |
| 1969 | 132 459 200 $ US | - |
| 1968 | 121 194 900 $ US | - |
| 1967 | 112 359 200 $ US | - |
| 1966 | 215 353 490 $ US | - |
| 1965 | 239 053 520 $ US | - |
| 1964 | 228 053 520 $ US | - |
| 1963 | 210 030 680 $ US | - |
| 1962 | 289 024 970 $ US | - |
| 1961 | 307 070 650 $ US | - |
| 1960 | 343 000 000 $ US | - |
En 2025, les réserves de change du Nigeria s'élevaient à 46 milliards de dollars et celles de l'Angola à 13,5 milliards de dollars : celles du Nigeria étaient 3,4 fois plus élevées. En 1995, les réserves du Nigeria étaient 7,5 fois plus élevées : 1,71 milliard de dollars pour le Nigeria et 228 millions de dollars pour l'Angola.
Les réserves de change du Nigeria sont supérieures à celles de l'Angola chaque année depuis 1995.
Nigeria vs Angola : réserves, or compris, et mois d'importations couverts
|
Nigeria
|
Angola
|
|
|---|---|---|
| Réserves, or compris | 46,0 Md $US | 13,5 Md $US |
| Mois d'importations | n.d. | 11,4 (2025) |
| Rang mondial | 53/168 | 74/168 |
| Écart des réserves | 3,4× | 0,29× |
Comparer les réserves de change de 2 pays au choix
Sources :
- Banque mondiale | Économie et croissance (1960–2025, mis à jour en octobre 2026)
Creative Commons Attribution (CC BY) : vous pouvez copier, partager, adapter et réutiliser ce contenu, y compris à des fins commerciales, à condition de citer statistics.wiki et d’indiquer les modifications apportées. Les sources citées ci-dessus peuvent avoir leurs propres conditions de licence.