
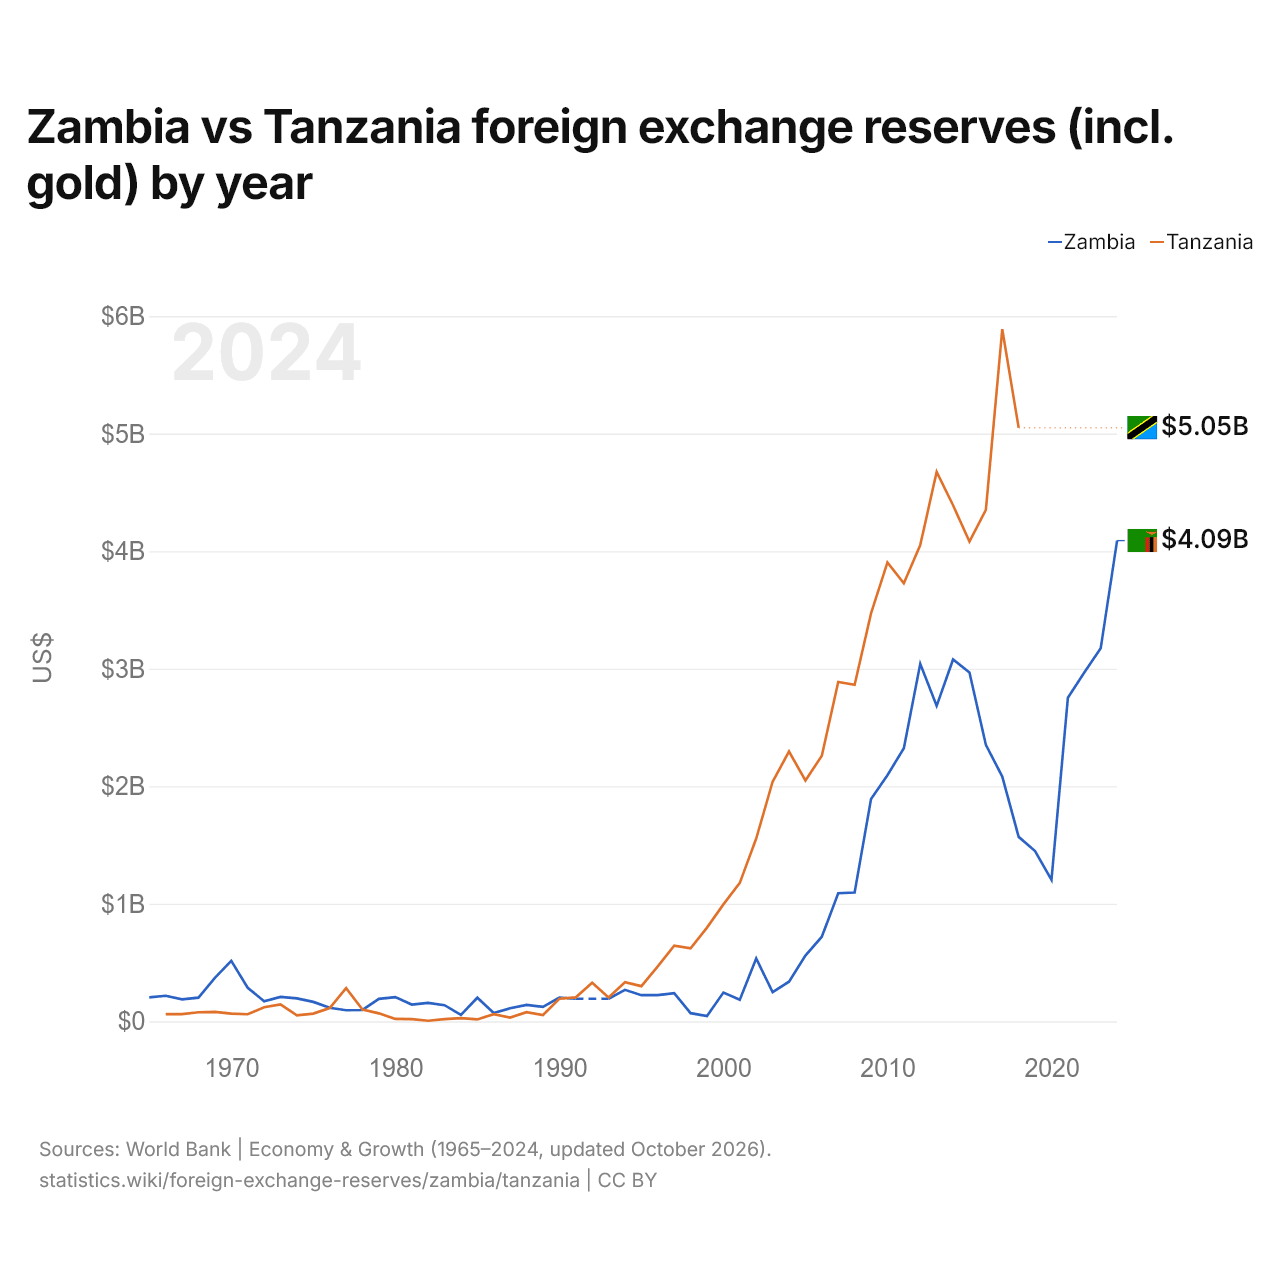
Zambie vs Tanzanie : réserves de change (or compris) par année
1x
| Année | $ US | |
|---|---|---|
 Zambie |
 Tanzanie |
|
| 2024 | 4 089 834 508 $ US | - |
| 2023 | 3 173 177 777 $ US | - |
| 2022 | 2 967 565 317 $ US | - |
| 2021 | 2 753 875 454 $ US | - |
| 2020 | 1 203 448 374 $ US | - |
| 2019 | 1 448 624 290 $ US | - |
| 2018 | 1 569 229 906 $ US | 5 049 646 420 $ US |
| 2017 | 2 082 083 920 $ US | 5 887 869 885 $ US |
| 2016 | 2 352 719 004 $ US | 4 350 687 048 $ US |
| 2015 | 2 967 626 716 $ US | 4 080 762 378 $ US |
| 2014 | 3 078 362 297 $ US | 4 390 430 241 $ US |
| 2013 | 2 683 813 403 $ US | 4 673 729 809 $ US |
| 2012 | 3 042 223 849 $ US | 4 052 224 338 $ US |
| 2011 | 2 324 018 127 $ US | 3 726 158 402 $ US |
| 2010 | 2 093 753 266 $ US | 3 904 676 572 $ US |
| 2009 | 1 892 077 713 $ US | 3 470 413 229 $ US |
| 2008 | 1 095 608 609 $ US | 2 862 895 993 $ US |
| 2007 | 1 089 952 023 $ US | 2 886 381 414 $ US |
| 2006 | 719 716 912 $ US | 2 259 345 786 $ US |
| 2005 | 559 788 508 $ US | 2 048 775 519 $ US |
| 2004 | 337 106 225 $ US | 2 295 701 466 $ US |
| 2003 | 247 729 407 $ US | 2 038 411 251 $ US |
| 2002 | 535 132 846 $ US | 1 554 545 483 $ US |
| 2001 | 183 446 872 $ US | 1 177 357 652 $ US |
| 2000 | 244 824 132 $ US | 994 821 490 $ US |
| 1999 | 45 429 576 $ US | 797 229 732 $ US |
| 1998 | 69 382 430 $ US | 620 743 980 $ US |
| 1997 | 239 085 490 $ US | 643 830 445 $ US |
| 1996 | 222 709 085 $ US | 467 780 725 $ US |
| 1995 | 222 702 264 $ US | 299 209 721 $ US |
| 1994 | 268 127 772 $ US | 332 066 144 $ US |
| 1993 | 192 326 098 $ US | 203 345 200 $ US |
| 1992 | - | 327 336 302 $ US |
| 1991 | 192 407 809 $ US | 203 908 583 $ US |
| 1990 | 201 213 453 $ US | 192 800 000 $ US |
| 1989 | 123 043 283 $ US | 54 213 142 $ US |
| 1988 | 139 360 164 $ US | 77 713 457 $ US |
| 1987 | 110 764 773 $ US | 31 799 306 $ US |
| 1986 | 71 497 164 $ US | 61 090 009 $ US |
| 1985 | 201 091 984 $ US | 16 000 000 $ US |
| 1984 | 54 826 402 $ US | 26 868 615 $ US |
| 1983 | 137 306 439 $ US | 19 415 165 $ US |
| 1982 | 157 342 358 $ US | 4 822 062 $ US |
| 1981 | 142 426 332 $ US | 18 827 909 $ US |
| 1980 | 206 121 500 $ US | 20 300 000 $ US |
| 1979 | 191 063 142 $ US | 68 041 223 $ US |
| 1978 | 96 515 885 $ US | 99 860 082 $ US |
| 1977 | 94 022 882 $ US | 281 826 685 $ US |
| 1976 | 115 298 692 $ US | 112 267 249 $ US |
| 1975 | 165 564 753 $ US | 65 446 257 $ US |
| 1974 | 195 695 676 $ US | 50 232 421 $ US |
| 1973 | 207 974 127 $ US | 144 616 443 $ US |
| 1972 | 171 375 429 $ US | 119 587 471 $ US |
| 1971 | 285 818 118 $ US | 60 253 184 $ US |
| 1970 | 514 838 710 $ US | 64 970 000 $ US |
| 1969 | 369 381 600 $ US | 80 260 000 $ US |
| 1968 | 201 207 700 $ US | 77 540 000 $ US |
| 1967 | 187 327 600 $ US | 61 710 000 $ US |
| 1966 | 217 613 970 $ US | 61 300 000 $ US |
| 1965 | 203 871 760 $ US | - |
Les réserves de change de la Zambie s'élèvent à 4,09 milliards de dollars (2024), et celles de la Tanzanie à 5,05 milliards de dollars (2018). En 1966, les réserves de la Zambie étaient 3,5 fois plus élevées : 218 millions de dollars pour la Zambie et 61,3 millions de dollars pour la Tanzanie.
Zambie vs Tanzanie : réserves, or compris, et mois d'importations couverts
|
Zambie
|
Tanzanie
|
|
|---|---|---|
| Réserves, or compris | 4,09 Md $US (2024) | 5,05 Md $US (2018) |
| Mois d'importations | 7,0 (2024) | 5,9 (2018) |
| Rang mondial | 107/168 | Non classé |
Comparer les réserves de change de 2 pays au choix
Sources :
- Banque mondiale | Économie et croissance (1965–2024, mis à jour en octobre 2026)
Creative Commons Attribution (CC BY) : vous pouvez copier, partager, adapter et réutiliser ce contenu, y compris à des fins commerciales, à condition de citer statistics.wiki et d’indiquer les modifications apportées. Les sources citées ci-dessus peuvent avoir leurs propres conditions de licence.