
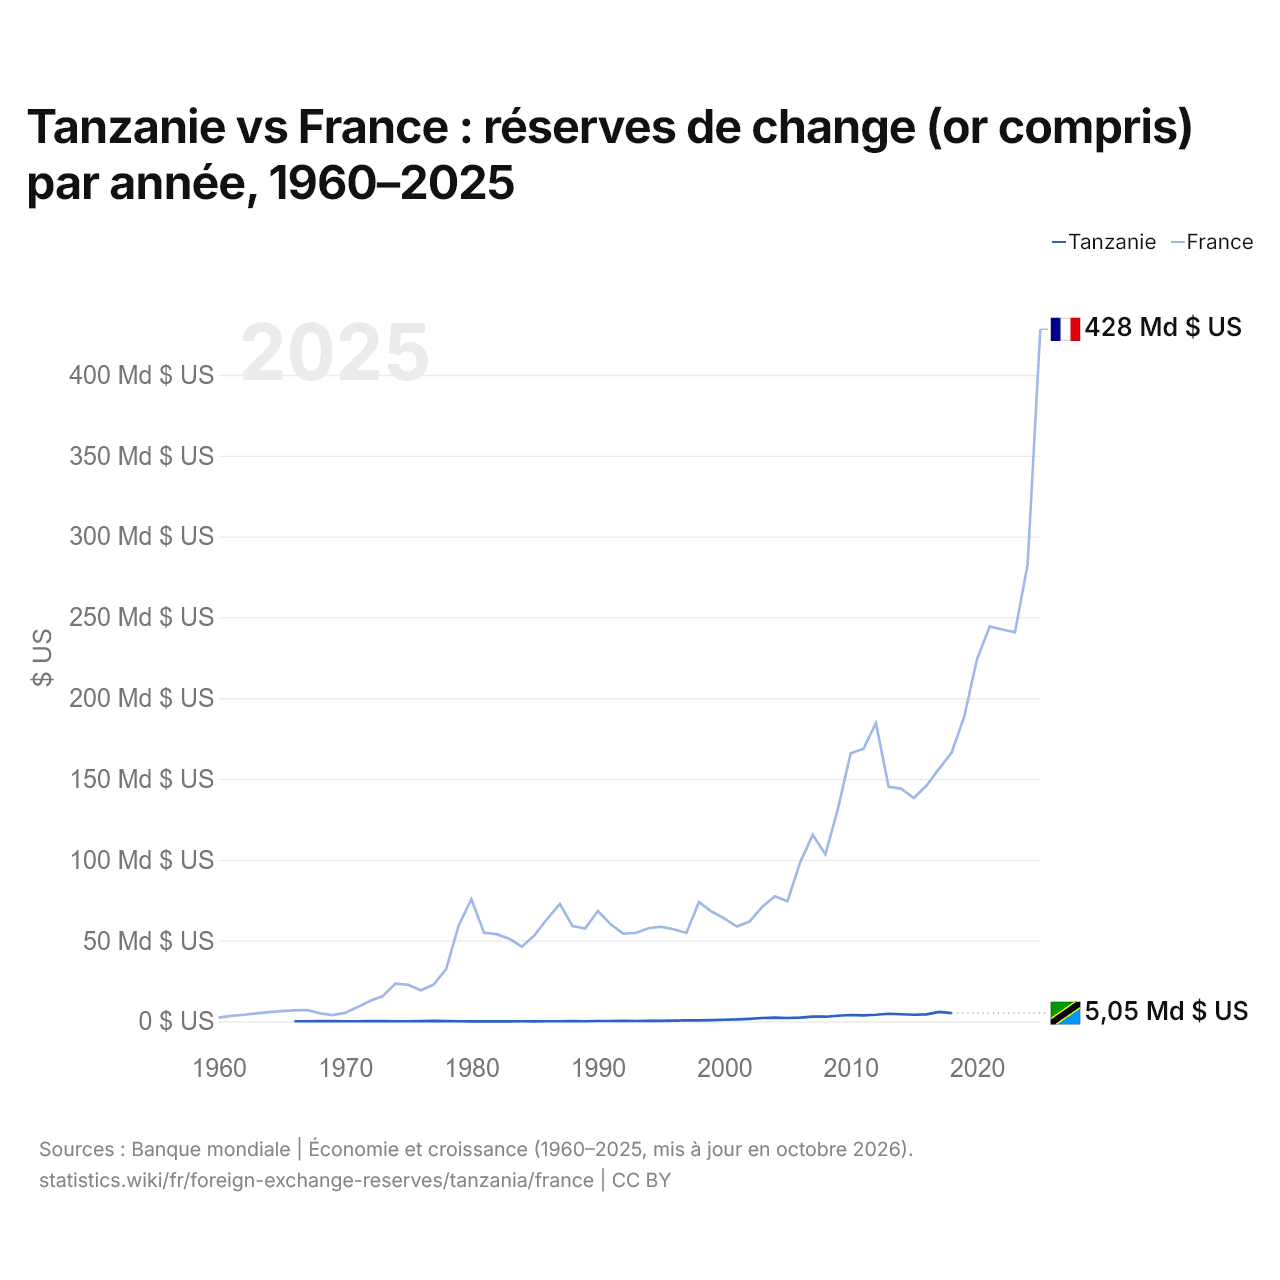
Tanzanie vs France : réserves de change (or compris) par année, 1960–2025
| Année | $ US | |
|---|---|---|
 Tanzanie |
 France |
|
| 2025 | - | 428 208 373 516 $ US |
| 2024 | - | 282 857 363 314 $ US |
| 2023 | - | 240 791 742 784 $ US |
| 2022 | - | 242 415 618 842 $ US |
| 2021 | - | 244 280 333 398 $ US |
| 2020 | - | 224 236 417 868 $ US |
| 2019 | - | 189 006 435 295 $ US |
| 2018 | 5 049 646 420 $ US | 166 483 400 197 $ US |
| 2017 | 5 887 869 885 $ US | 156 322 431 109 $ US |
| 2016 | 4 350 687 048 $ US | 145 866 068 770 $ US |
| 2015 | 4 080 762 378 $ US | 138 198 984 338 $ US |
| 2014 | 4 390 430 241 $ US | 143 977 104 333 $ US |
| 2013 | 4 673 729 809 $ US | 145 161 108 179 $ US |
| 2012 | 4 052 224 338 $ US | 184 521 825 604 $ US |
| 2011 | 3 726 158 402 $ US | 168 490 291 144 $ US |
| 2010 | 3 904 676 572 $ US | 165 852 088 071 $ US |
| 2009 | 3 470 413 229 $ US | 131 785 833 333 $ US |
| 2008 | 2 862 895 993 $ US | 103 306 201 680 $ US |
| 2007 | 2 886 381 414 $ US | 115 487 080 914 $ US |
| 2006 | 2 259 345 786 $ US | 98 239 163 383 $ US |
| 2005 | 2 048 775 519 $ US | 74 359 915 676 $ US |
| 2004 | 2 295 701 466 $ US | 77 353 273 269 $ US |
| 2003 | 2 038 411 251 $ US | 70 762 382 919 $ US |
| 2002 | 1 554 545 483 $ US | 61 696 755 317 $ US |
| 2001 | 1 177 357 652 $ US | 58 637 344 264 $ US |
| 2000 | 994 821 490 $ US | 63 728 079 968 $ US |
| 1999 | 797 229 732 $ US | 67 926 850 858 $ US |
| 1998 | 620 743 980 $ US | 73 773 200 168 $ US |
| 1997 | 643 830 445 $ US | 54 693 127 782 $ US |
| 1996 | 467 780 725 $ US | 57 020 073 080 $ US |
| 1995 | 299 209 721 $ US | 58 509 689 575 $ US |
| 1994 | 332 066 144 $ US | 57 627 249 048 $ US |
| 1993 | 203 345 200 $ US | 54 624 424 139 $ US |
| 1992 | 327 336 302 $ US | 54 305 667 501 $ US |
| 1991 | 203 908 583 $ US | 60 227 056 602 $ US |
| 1990 | 192 800 000 $ US | 68 290 938 862 $ US |
| 1989 | 54 213 142 $ US | 57 433 917 022 $ US |
| 1988 | 77 713 457 $ US | 58 944 488 671 $ US |
| 1987 | 31 799 306 $ US | 72 674 290 443 $ US |
| 1986 | 61 090 009 $ US | 63 449 998 026 $ US |
| 1985 | 16 000 000 $ US | 53 354 349 370 $ US |
| 1984 | 26 868 615 $ US | 46 174 644 007 $ US |
| 1983 | 19 415 165 $ US | 51 077 749 562 $ US |
| 1982 | 4 822 062 $ US | 53 929 067 047 $ US |
| 1981 | 18 827 909 $ US | 54 798 129 412 $ US |
| 1980 | 20 300 000 $ US | 75 592 384 526 $ US |
| 1979 | 68 041 223 $ US | 59 520 673 561 $ US |
| 1978 | 99 860 082 $ US | 32 328 216 862 $ US |
| 1977 | 281 826 685 $ US | 22 642 593 460 $ US |
| 1976 | 112 267 249 $ US | 19 232 853 330 $ US |
| 1975 | 65 446 257 $ US | 22 613 021 741 $ US |
| 1974 | 50 232 421 $ US | 23 350 057 845 $ US |
| 1973 | 144 616 443 $ US | 15 594 821 968 $ US |
| 1972 | 119 587 471 $ US | 12 723 426 514 $ US |
| 1971 | 60 253 184 $ US | 8 819 835 375 $ US |
| 1970 | 64 970 000 $ US | 5 199 446 700 $ US |
| 1969 | 80 260 000 $ US | 3 853 168 000 $ US |
| 1968 | 77 540 000 $ US | 4 965 133 000 $ US |
| 1967 | 61 710 000 $ US | 7 023 698 000 $ US |
| 1966 | 61 300 000 $ US | 6 761 305 400 $ US |
| 1965 | - | 6 359 615 200 $ US |
| 1964 | - | 5 736 854 800 $ US |
| 1963 | - | 4 914 646 800 $ US |
| 1962 | - | 4 053 563 700 $ US |
| 1961 | - | 3 374 550 000 $ US |
| 1960 | - | 2 300 194 000 $ US |
Les réserves de change de la Tanzanie s'élèvent à 5,05 milliards de dollars (2018), et celles de la France à 428 milliards de dollars (2025). En 1966, les réserves de la France étaient 110 fois plus élevées : 61,3 millions de dollars pour la Tanzanie et 6,76 milliards de dollars pour la France.
Les réserves de change de la France sont supérieures à celles de la Tanzanie chaque année depuis 1966.
Tanzanie vs France : réserves, or compris, et mois d'importations couverts
|
Tanzanie
|
France
|
|
|---|---|---|
| Réserves, or compris | 5,05 Md $US (2018) | 428 Md $US (2025) |
| Mois d'importations | 5,9 (2018) | 4,5 (2025) |
| Rang mondial | Non classé | 12/168 |
Comparer les réserves de change de 2 pays au choix
Sources :
- Banque mondiale | Économie et croissance (1960–2025, mis à jour en octobre 2026)
Creative Commons Attribution (CC BY) : vous pouvez copier, partager, adapter et réutiliser ce contenu, y compris à des fins commerciales, à condition de citer statistics.wiki et d’indiquer les modifications apportées. Les sources citées ci-dessus peuvent avoir leurs propres conditions de licence.