
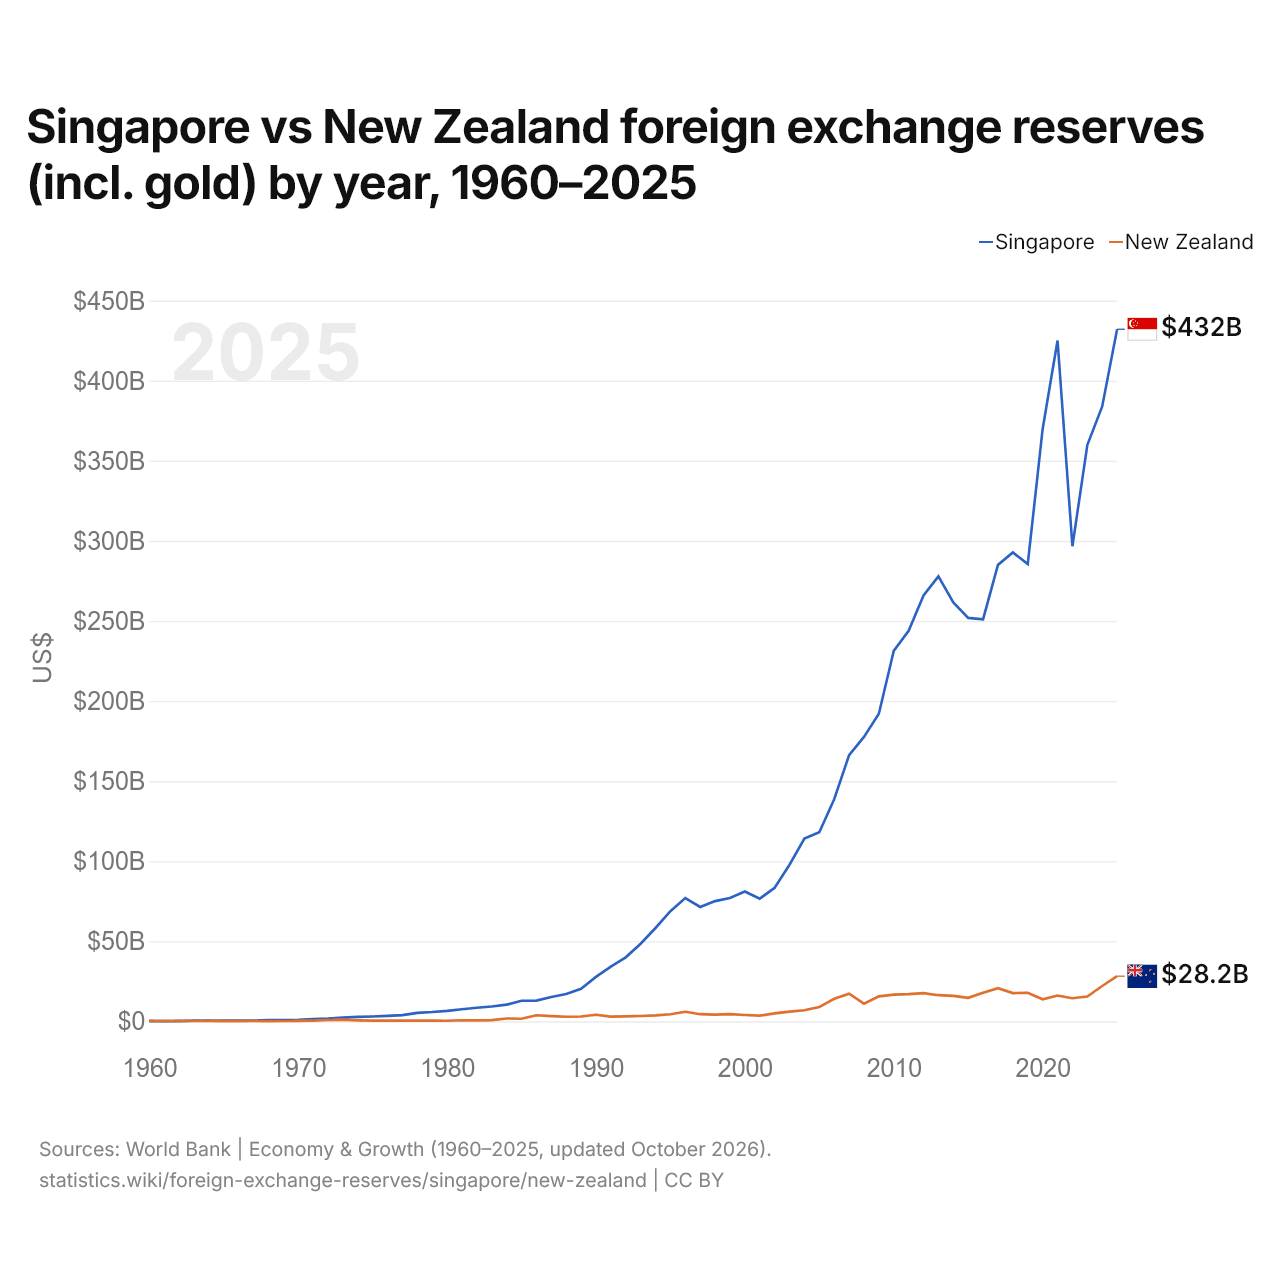
Singapour vs Nouvelle-Zélande : réserves de change (or compris) par année, 1960–2025
| Année | $ US | |
|---|---|---|
 Singapour |
 Nouvelle-Zélande |
|
| 2025 | 432 113 578 989 $ US | 28 152 498 624 $ US |
| 2024 | 383 945 953 551 $ US | 22 065 156 554 $ US |
| 2023 | 359 834 756 846 $ US | 15 487 380 828 $ US |
| 2022 | 296 628 740 109 $ US | 14 399 554 617 $ US |
| 2021 | 425 097 835 211 $ US | 16 113 750 240 $ US |
| 2020 | 369 834 181 900 $ US | 13 733 288 689 $ US |
| 2019 | 285 477 830 549 $ US | 17 813 501 891 $ US |
| 2018 | 292 715 632 357 $ US | 17 656 593 020 $ US |
| 2017 | 285 000 274 600 $ US | 20 683 740 691 $ US |
| 2016 | 251 058 293 462 $ US | 17 808 384 490 $ US |
| 2015 | 251 875 782 495 $ US | 14 699 798 263 $ US |
| 2014 | 261 582 777 243 $ US | 15 861 069 905 $ US |
| 2013 | 277 797 711 590 $ US | 16 317 764 963 $ US |
| 2012 | 265 910 197 708 $ US | 17 582 960 688 $ US |
| 2011 | 243 798 272 471 $ US | 17 011 945 022 $ US |
| 2010 | 231 259 743 358 $ US | 16 722 654 736 $ US |
| 2009 | 192 046 029 172 $ US | 15 594 002 509 $ US |
| 2008 | 177 543 472 508 $ US | 11 052 155 510 $ US |
| 2007 | 166 160 593 182 $ US | 17 247 175 110 $ US |
| 2006 | 138 652 617 421 $ US | 14 068 475 834 $ US |
| 2005 | 118 061 328 491 $ US | 8 892 727 558 $ US |
| 2004 | 114 161 298 698 $ US | 6 947 354 918 $ US |
| 2003 | 97 742 808 490 $ US | 6 085 430 342 $ US |
| 2002 | 83 413 380 412 $ US | 4 962 816 762 $ US |
| 2001 | 76 599 880 561 $ US | 3 564 653 927 $ US |
| 2000 | 81 084 978 989 $ US | 3 952 081 062 $ US |
| 1999 | 77 047 140 632 $ US | 4 455 337 955 $ US |
| 1998 | 75 077 193 404 $ US | 4 203 708 705 $ US |
| 1997 | 71 390 079 572 $ US | 4 451 316 560 $ US |
| 1996 | 76 963 971 491 $ US | 5 953 469 110 $ US |
| 1995 | 68 816 102 850 $ US | 4 409 840 589 $ US |
| 1994 | 58 295 758 863 $ US | 3 708 505 758 $ US |
| 1993 | 48 416 241 488 $ US | 3 337 384 444 $ US |
| 1992 | 39 941 405 840 $ US | 3 079 489 190 $ US |
| 1991 | 34 186 648 638 $ US | 2 950 278 021 $ US |
| 1990 | 27 789 982 289 $ US | 4 129 354 287 $ US |
| 1989 | 20 371 048 593 $ US | 3 027 432 007 $ US |
| 1988 | 17 072 512 756 $ US | 2 845 129 943 $ US |
| 1987 | 15 227 011 369 $ US | 3 270 435 793 $ US |
| 1986 | 12 938 978 725 $ US | 3 779 914 173 $ US |
| 1985 | 12 846 550 088 $ US | 1 603 038 945 $ US |
| 1984 | 10 415 963 053 $ US | 1 793 573 440 $ US |
| 1983 | 9 264 230 226 $ US | 786 180 150 $ US |
| 1982 | 8 479 773 883 $ US | 646 131 513 $ US |
| 1981 | 7 549 238 397 $ US | 682 774 524 $ US |
| 1980 | 6 566 785 017 $ US | 365 276 663 $ US |
| 1979 | 5 818 480 920 $ US | 473 984 277 $ US |
| 1978 | 5 302 666 625 $ US | 465 822 282 $ US |
| 1977 | 3 857 669 710 $ US | 449 817 030 $ US |
| 1976 | 3 363 763 125 $ US | 493 834 469 $ US |
| 1975 | 3 006 633 951 $ US | 430 065 728 $ US |
| 1974 | 2 811 935 428 $ US | 642 844 475 $ US |
| 1973 | 2 285 755 202 $ US | 1 047 638 200 $ US |
| 1972 | 1 748 418 886 $ US | 833 644 612 $ US |
| 1971 | 1 452 297 172 $ US | 492 952 623 $ US |
| 1970 | 1 012 040 000 $ US | 257 723 142 $ US |
| 1969 | 826 630 000 $ US | 209 849 306 $ US |
| 1968 | 712 420 000 $ US | 161 709 283 $ US |
| 1967 | 495 600 000 $ US | 218 554 189 $ US |
| 1966 | 394 300 000 $ US | 179 191 434 $ US |
| 1965 | 430 100 000 $ US | 173 296 694 $ US |
| 1964 | 431 000 000 $ US | 257 817 310 $ US |
| 1963 | 433 200 000 $ US | 212 806 687 $ US |
| 1962 | 165 000 000 $ US | 250 806 531 $ US |
| 1961 | 123 000 000 $ US | 180 797 778 $ US |
| 1960 | 115 000 000 $ US | 287 599 929 $ US |
En 2025, les réserves de change de Singapour s'élevaient à 432 milliards de dollars et celles de la Nouvelle-Zélande à 28,2 milliards de dollars : celles de Singapour étaient 15 fois plus élevées. En 1960, les réserves de la Nouvelle-Zélande étaient 2,5 fois plus élevées : 115 millions de dollars pour Singapour et 288 millions de dollars pour la Nouvelle-Zélande.
Les réserves de change de Singapour sont supérieures à celles de la Nouvelle-Zélande chaque année depuis 1963.
Singapour vs Nouvelle-Zélande : réserves, or compris, et mois d'importations couverts
|
Singapour
|
Nouvelle-Zélande
|
|
|---|---|---|
| Réserves, or compris | 432 Md $US | 28,2 Md $US |
| Mois d'importations | 6,0 | 4,9 |
| Rang mondial | 11/168 | 59/168 |
| Écart des réserves | 15× | 0,065× |
Comparer les réserves de change de 2 pays au choix
Sources :
- Banque mondiale | Économie et croissance (1960–2025, mis à jour en octobre 2026)
Creative Commons Attribution (CC BY) : vous pouvez copier, partager, adapter et réutiliser ce contenu, y compris à des fins commerciales, à condition de citer statistics.wiki et d’indiquer les modifications apportées. Les sources citées ci-dessus peuvent avoir leurs propres conditions de licence.