
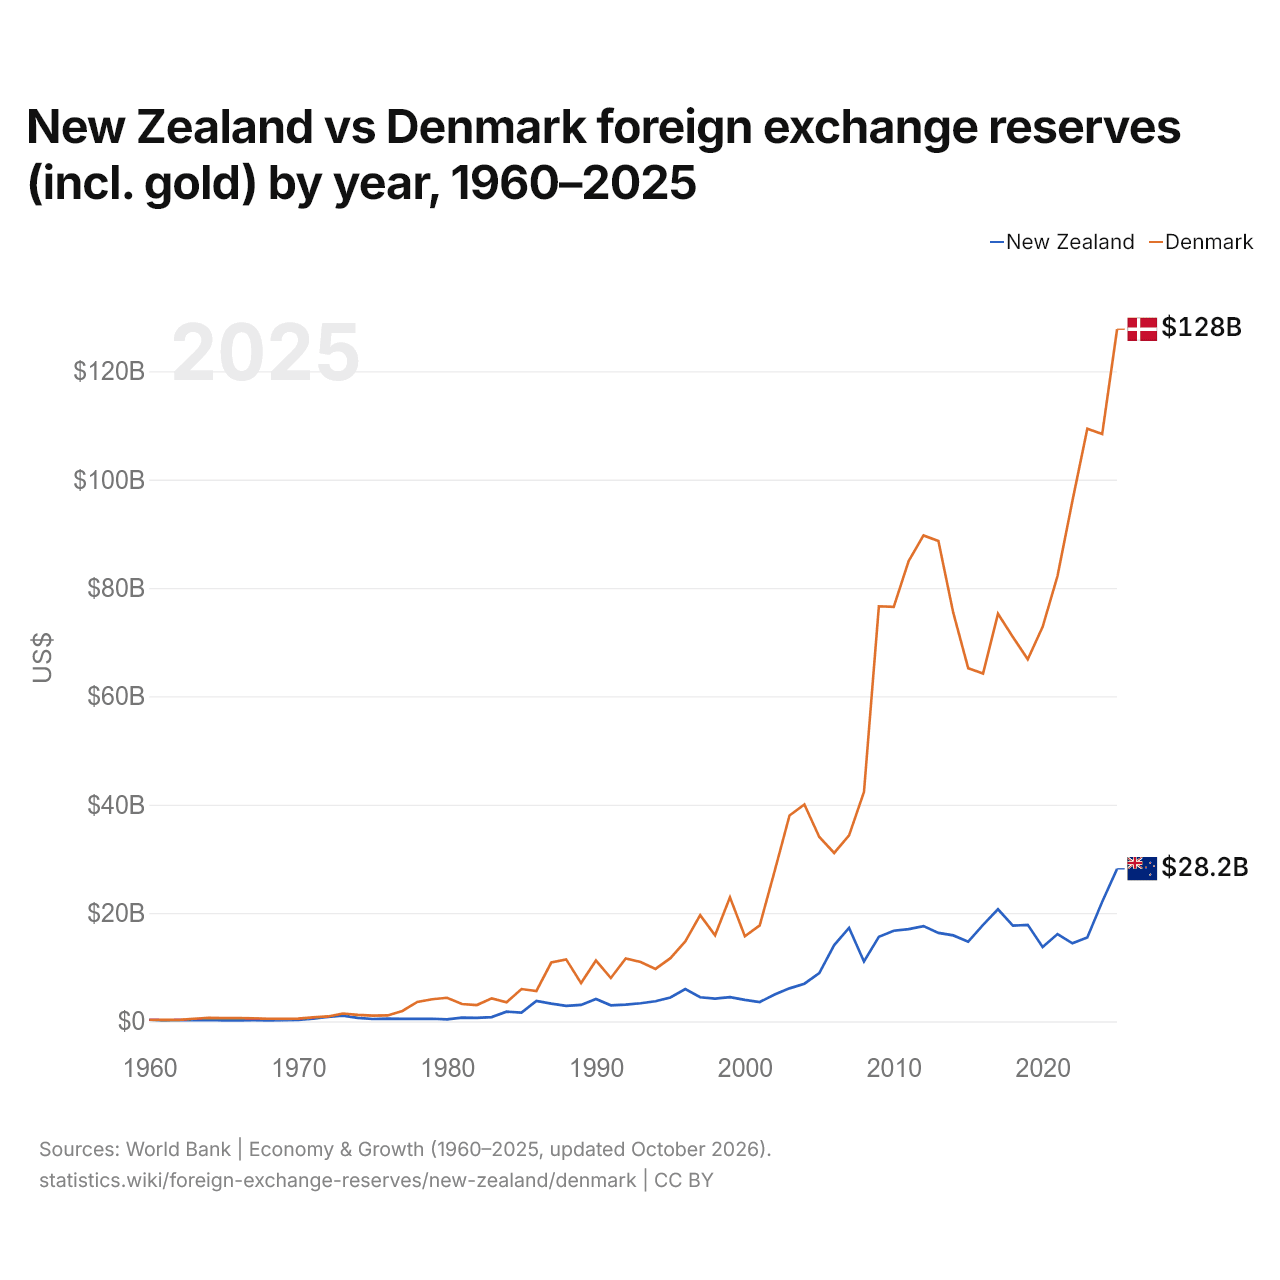
Nouvelle-Zélande vs Danemark : réserves de change (or compris) par année, 1960–2025
| Année | $ US | |
|---|---|---|
 Nouvelle-Zélande |
 Danemark |
|
| 2025 | 28 152 498 624 $ US | 127 756 364 612 $ US |
| 2024 | 22 065 156 554 $ US | 108 405 100 883 $ US |
| 2023 | 15 487 380 828 $ US | 109 370 841 824 $ US |
| 2022 | 14 399 554 617 $ US | 96 072 552 269 $ US |
| 2021 | 16 113 750 240 $ US | 82 235 844 736 $ US |
| 2020 | 13 733 288 689 $ US | 72 823 350 927 $ US |
| 2019 | 17 813 501 891 $ US | 66 835 547 934 $ US |
| 2018 | 17 656 593 020 $ US | 70 942 078 374 $ US |
| 2017 | 20 683 740 691 $ US | 75 244 445 866 $ US |
| 2016 | 17 808 384 490 $ US | 64 215 805 620 $ US |
| 2015 | 14 699 798 263 $ US | 65 185 093 406 $ US |
| 2014 | 15 861 069 905 $ US | 75 391 887 669 $ US |
| 2013 | 16 317 764 963 $ US | 88 676 584 007 $ US |
| 2012 | 17 582 960 688 $ US | 89 697 829 678 $ US |
| 2011 | 17 011 945 022 $ US | 84 955 222 078 $ US |
| 2010 | 16 722 654 736 $ US | 76 510 022 326 $ US |
| 2009 | 15 594 002 509 $ US | 76 617 709 422 $ US |
| 2008 | 11 052 155 510 $ US | 42 326 707 927 $ US |
| 2007 | 17 247 175 110 $ US | 34 318 338 718 $ US |
| 2006 | 14 068 475 834 $ US | 31 083 835 098 $ US |
| 2005 | 8 892 727 558 $ US | 34 028 012 497 $ US |
| 2004 | 6 947 354 918 $ US | 40 020 822 397 $ US |
| 2003 | 6 085 430 342 $ US | 37 997 724 766 $ US |
| 2002 | 4 962 816 762 $ US | 27 719 142 484 $ US |
| 2001 | 3 564 653 927 $ US | 17 702 199 723 $ US |
| 2000 | 3 952 081 062 $ US | 15 695 951 233 $ US |
| 1999 | 4 455 337 955 $ US | 22 908 487 684 $ US |
| 1998 | 4 203 708 705 $ US | 15 880 864 795 $ US |
| 1997 | 4 451 316 560 $ US | 19 613 799 547 $ US |
| 1996 | 5 953 469 110 $ US | 14 754 070 655 $ US |
| 1995 | 4 409 840 589 $ US | 11 652 290 058 $ US |
| 1994 | 3 708 505 758 $ US | 9 680 246 577 $ US |
| 1993 | 3 337 384 444 $ US | 10 941 474 547 $ US |
| 1992 | 3 079 489 190 $ US | 11 596 802 127 $ US |
| 1991 | 2 950 278 021 $ US | 7 990 191 790 $ US |
| 1990 | 4 129 354 287 $ US | 11 225 840 672 $ US |
| 1989 | 3 027 432 007 $ US | 7 053 627 355 $ US |
| 1988 | 2 845 129 943 $ US | 11 433 249 793 $ US |
| 1987 | 3 270 435 793 $ US | 10 854 481 762 $ US |
| 1986 | 3 779 914 173 $ US | 5 601 249 773 $ US |
| 1985 | 1 603 038 945 $ US | 5 961 248 202 $ US |
| 1984 | 1 793 573 440 $ US | 3 511 129 161 $ US |
| 1983 | 786 180 150 $ US | 4 242 152 680 $ US |
| 1982 | 646 131 513 $ US | 3 009 958 068 $ US |
| 1981 | 682 774 524 $ US | 3 195 167 219 $ US |
| 1980 | 365 276 663 $ US | 4 347 048 285 $ US |
| 1979 | 473 984 277 $ US | 4 075 276 491 $ US |
| 1978 | 465 822 282 $ US | 3 576 473 669 $ US |
| 1977 | 449 817 030 $ US | 1 906 323 391 $ US |
| 1976 | 493 834 469 $ US | 1 085 798 462 $ US |
| 1975 | 430 065 728 $ US | 1 056 989 138 $ US |
| 1974 | 642 844 475 $ US | 1 195 732 106 $ US |
| 1973 | 1 047 638 200 $ US | 1 450 865 798 $ US |
| 1972 | 833 644 612 $ US | 903 602 411 $ US |
| 1971 | 492 952 623 $ US | 732 048 348 $ US |
| 1970 | 257 723 142 $ US | 487 940 280 $ US |
| 1969 | 209 849 306 $ US | 446 662 400 $ US |
| 1968 | 161 709 283 $ US | 471 330 200 $ US |
| 1967 | 218 554 189 $ US | 535 507 200 $ US |
| 1966 | 179 191 434 $ US | 597 676 340 $ US |
| 1965 | 173 296 694 $ US | 587 293 840 $ US |
| 1964 | 257 817 310 $ US | 645 440 720 $ US |
| 1963 | 212 806 687 $ US | 470 635 320 $ US |
| 1962 | 250 806 531 $ US | 255 803 820 $ US |
| 1961 | 180 797 778 $ US | 282 882 350 $ US |
| 1960 | 287 599 929 $ US | 287 547 600 $ US |
En 2025, les réserves de change de la Nouvelle-Zélande s'élevaient à 28,2 milliards de dollars et celles du Danemark à 128 milliards de dollars : celles du Danemark étaient 4,5 fois plus élevées. En 1960, les réserves de la Nouvelle-Zélande étaient supérieures de 0,018 % : 288 millions de dollars pour la Nouvelle-Zélande et 288 millions de dollars pour le Danemark.
Les réserves de change du Danemark sont supérieures à celles de la Nouvelle-Zélande chaque année depuis 1961.
Nouvelle-Zélande vs Danemark : réserves, or compris, et mois d'importations couverts
|
Nouvelle-Zélande
|
Danemark
|
|
|---|---|---|
| Réserves, or compris | 28,2 Md $US | 128 Md $US |
| Mois d'importations | 4,9 | 5,6 |
| Rang mondial | 59/168 | 24/168 |
| Écart des réserves | 0,22× | 4,5× |
Comparer les réserves de change de 2 pays au choix
Sources :
- Banque mondiale | Économie et croissance (1960–2025, mis à jour en octobre 2026)
Creative Commons Attribution (CC BY) : vous pouvez copier, partager, adapter et réutiliser ce contenu, y compris à des fins commerciales, à condition de citer statistics.wiki et d’indiquer les modifications apportées. Les sources citées ci-dessus peuvent avoir leurs propres conditions de licence.