
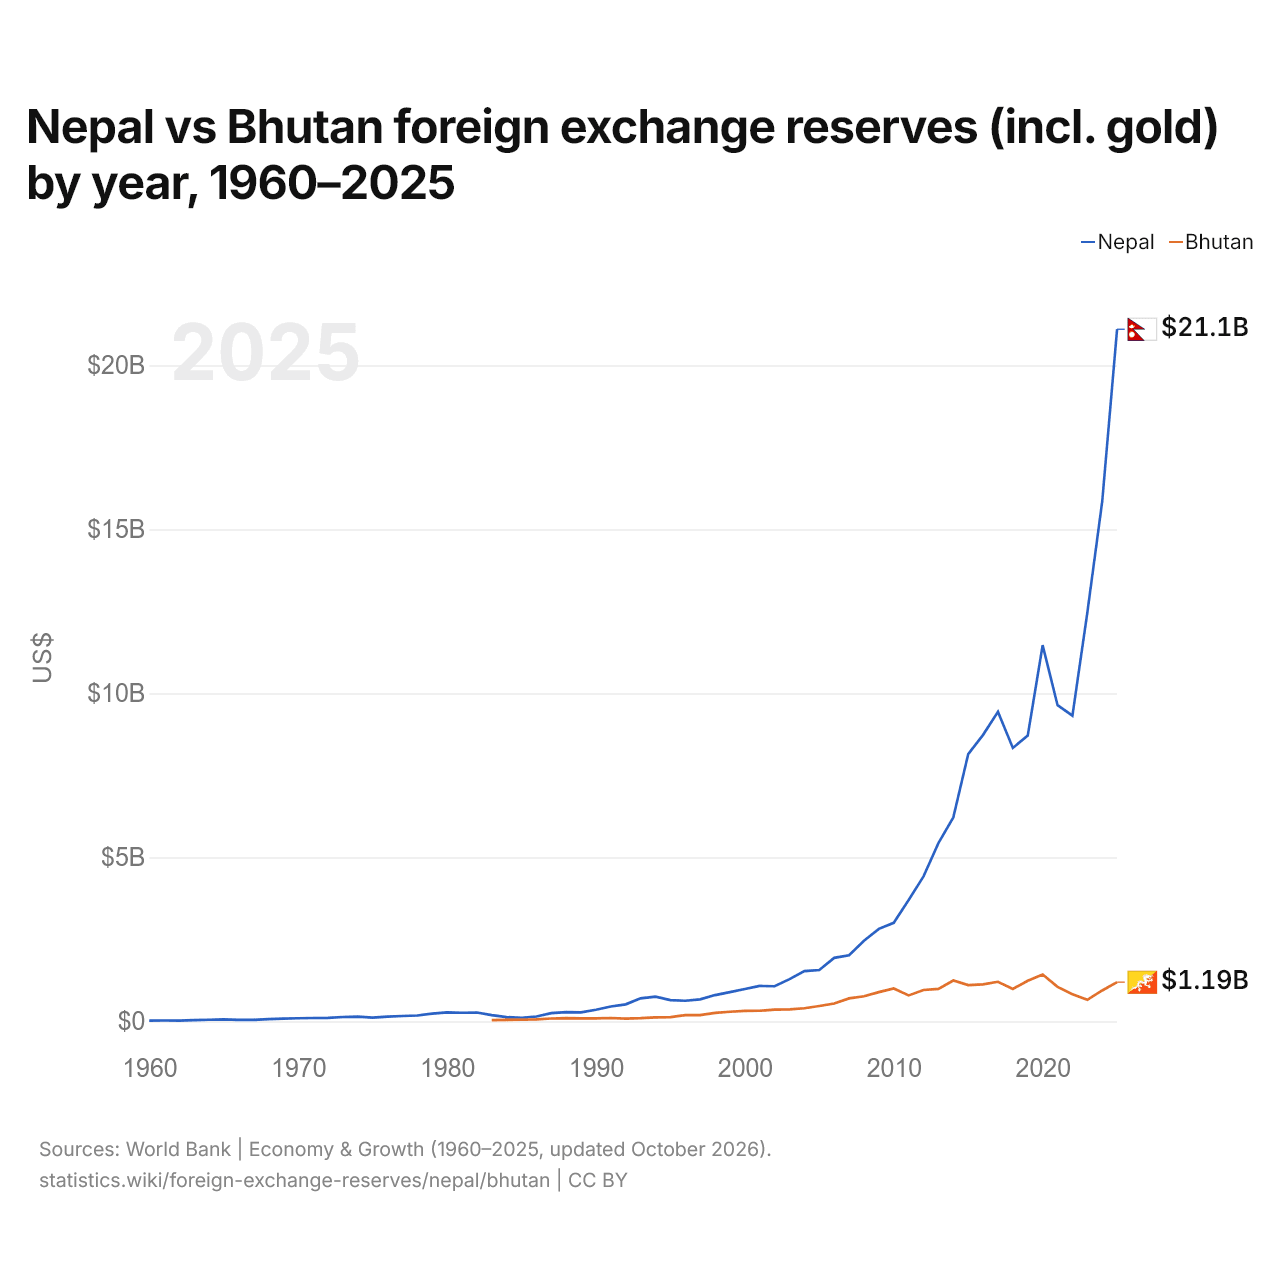
Népal vs Bhoutan : réserves de change (or compris) par année, 1960–2025
| Année | $ US | |
|---|---|---|
 Népal |
 Bhoutan |
|
| 2025 | 21 100 332 322 $ US | 1 193 813 118 $ US |
| 2024 | 15 846 781 299 $ US | 941 017 689 $ US |
| 2023 | 12 456 122 669 $ US | 654 480 752 $ US |
| 2022 | 9 319 150 273 $ US | 825 755 412 $ US |
| 2021 | 9 638 842 484 $ US | 1 049 605 755 $ US |
| 2020 | 11 467 799 302 $ US | 1 426 914 818 $ US |
| 2019 | 8 713 166 195 $ US | 1 238 371 618 $ US |
| 2018 | 8 335 473 017 $ US | 987 247 036 $ US |
| 2017 | 9 435 255 967 $ US | 1 206 238 191 $ US |
| 2016 | 8 734 510 299 $ US | 1 127 277 332 $ US |
| 2015 | 8 145 463 908 $ US | 1 103 179 129 $ US |
| 2014 | 6 216 255 070 $ US | 1 245 086 667 $ US |
| 2013 | 5 434 181 403 $ US | 991 306 676 $ US |
| 2012 | 4 417 738 496 $ US | 954 678 385 $ US |
| 2011 | 3 702 502 162 $ US | 789 643 752 $ US |
| 2010 | 3 002 724 838 $ US | 1 002 139 102 $ US |
| 2009 | 2 819 466 154 $ US | 890 893 417 $ US |
| 2008 | 2 457 914 115 $ US | 764 803 121 $ US |
| 2007 | 2 014 032 856 $ US | 699 049 465 $ US |
| 2006 | 1 935 487 673 $ US | 545 324 765 $ US |
| 2005 | 1 565 203 520 $ US | 467 426 181 $ US |
| 2004 | 1 529 099 986 $ US | 398 620 012 $ US |
| 2003 | 1 286 240 900 $ US | 366 596 386 $ US |
| 2002 | 1 070 003 807 $ US | 354 949 465 $ US |
| 2001 | 1 079 959 914 $ US | 323 362 187 $ US |
| 2000 | 987 342 047 $ US | 317 632 401 $ US |
| 1999 | 889 429 673 $ US | 292 285 630 $ US |
| 1998 | 800 272 085 $ US | 256 803 121 $ US |
| 1997 | 670 587 740 $ US | 188 716 779 $ US |
| 1996 | 627 771 666 $ US | 190 071 378 $ US |
| 1995 | 645 536 746 $ US | 130 457 701 $ US |
| 1994 | 752 158 919 $ US | 121 399 998 $ US |
| 1993 | 699 898 113 $ US | 97 959 126 $ US |
| 1992 | 518 336 214 $ US | 85 120 005 $ US |
| 1991 | 450 982 960 $ US | 101 300 001 $ US |
| 1990 | 354 107 095 $ US | 88 834 211 $ US |
| 1989 | 272 846 716 $ US | 90 027 656 $ US |
| 1988 | 282 826 478 $ US | 95 679 183 $ US |
| 1987 | 251 413 397 $ US | 86 949 130 $ US |
| 1986 | 145 886 829 $ US | 61 001 774 $ US |
| 1985 | 105 467 402 $ US | 53 322 920 $ US |
| 1984 | 128 600 058 $ US | 43 047 368 $ US |
| 1983 | 191 064 674 $ US | 35 480 123 $ US |
| 1982 | 268 378 934 $ US | - |
| 1981 | 262 066 242 $ US | - |
| 1980 | 271 948 974 $ US | - |
| 1979 | 235 268 995 $ US | - |
| 1978 | 178 077 054 $ US | - |
| 1977 | 161 385 891 $ US | - |
| 1976 | 145 042 574 $ US | - |
| 1975 | 113 974 569 $ US | - |
| 1974 | 145 577 564 $ US | - |
| 1973 | 132 121 707 $ US | - |
| 1972 | 107 173 202 $ US | - |
| 1971 | 102 268 065 $ US | - |
| 1970 | 94 202 508 $ US | - |
| 1969 | 83 753 427 $ US | - |
| 1968 | 65 316 280 $ US | - |
| 1967 | 46 384 506 $ US | - |
| 1966 | 44 983 567 $ US | - |
| 1965 | 59 519 654 $ US | - |
| 1964 | 49 119 654 $ US | - |
| 1963 | 36 256 170 $ US | - |
| 1962 | 24 045 769 $ US | - |
| 1961 | 24 149 980 $ US | - |
| 1960 | 19 273 664 $ US | - |
En 2025, les réserves de change du Népal s'élevaient à 21,1 milliards de dollars et celles du Bhoutan à 1,19 milliard de dollars : celles du Népal étaient 18 fois plus élevées. En 1983, les réserves du Népal étaient 5,4 fois plus élevées : 191 millions de dollars pour le Népal et 35,5 millions de dollars pour le Bhoutan.
Les réserves de change du Népal sont supérieures à celles du Bhoutan chaque année depuis 1983.
Népal vs Bhoutan : réserves, or compris, et mois d'importations couverts
|
Népal
|
Bhoutan
|
|
|---|---|---|
| Réserves, or compris | 21,1 Md $US | 1,19 Md $US |
| Mois d'importations | 16,5 (2025) | 7,0 (2024) |
| Rang mondial | 65/168 | 135/168 |
| Écart des réserves | 18× | 0,057× |
Comparer les réserves de change de 2 pays au choix
Sources :
- Banque mondiale | Économie et croissance (1960–2025, mis à jour en octobre 2026)
Creative Commons Attribution (CC BY) : vous pouvez copier, partager, adapter et réutiliser ce contenu, y compris à des fins commerciales, à condition de citer statistics.wiki et d’indiquer les modifications apportées. Les sources citées ci-dessus peuvent avoir leurs propres conditions de licence.