
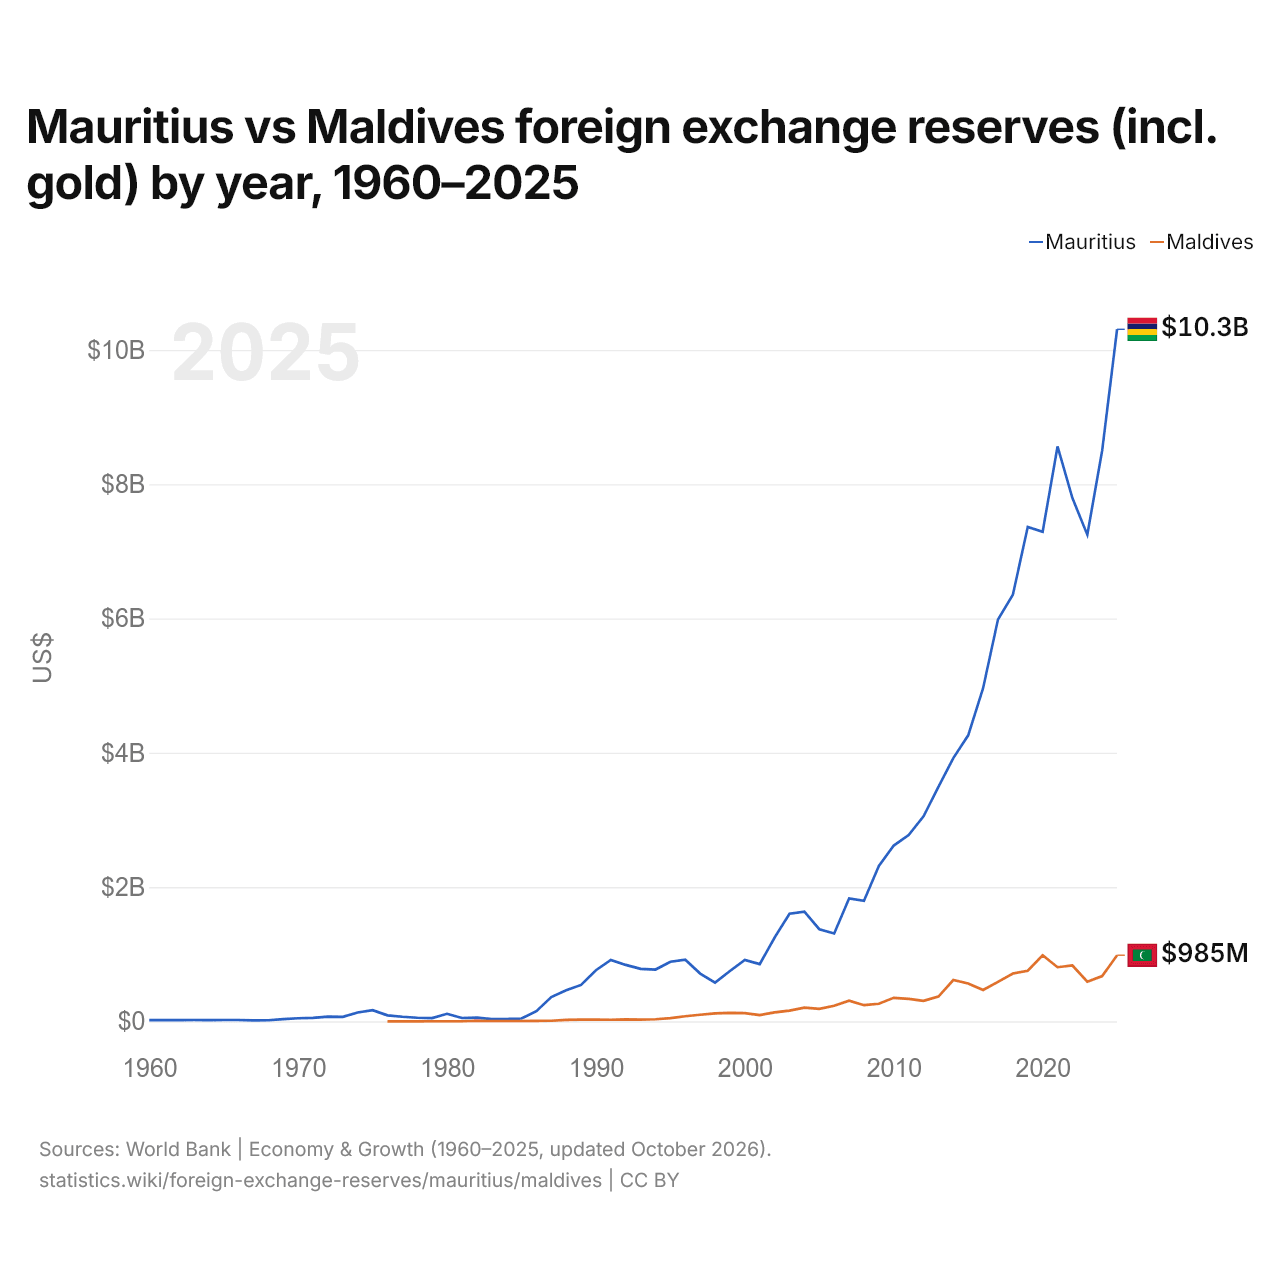
Maurice vs Maldives : réserves de change (or compris) par année, 1960–2025
| Année | $ US | |
|---|---|---|
 Maurice |
 Maldives |
|
| 2025 | 10 308 130 279 $ US | 984 573 592 $ US |
| 2024 | 8 506 134 285 $ US | 673 885 913 $ US |
| 2023 | 7 247 890 260 $ US | 590 522 551 $ US |
| 2022 | 7 792 807 408 $ US | 832 094 353 $ US |
| 2021 | 8 562 656 040 $ US | 805 808 189 $ US |
| 2020 | 7 291 065 336 $ US | 984 930 745 $ US |
| 2019 | 7 362 471 786 $ US | 753 496 280 $ US |
| 2018 | 6 353 096 296 $ US | 712 157 734 $ US |
| 2017 | 5 984 338 262 $ US | 587 346 817 $ US |
| 2016 | 4 962 069 842 $ US | 467 323 386 $ US |
| 2015 | 4 259 691 508 $ US | 563 873 735 $ US |
| 2014 | 3 920 880 590 $ US | 614 684 246 $ US |
| 2013 | 3 490 767 904 $ US | 368 315 039 $ US |
| 2012 | 3 053 007 539 $ US | 304 506 181 $ US |
| 2011 | 2 775 245 693 $ US | 334 913 163 $ US |
| 2010 | 2 618 620 803 $ US | 350 103 579 $ US |
| 2009 | 2 315 555 503 $ US | 260 981 130 $ US |
| 2008 | 1 796 126 154 $ US | 240 580 314 $ US |
| 2007 | 1 831 736 327 $ US | 308 403 900 $ US |
| 2006 | 1 308 850 537 $ US | 231 550 006 $ US |
| 2005 | 1 371 551 308 $ US | 186 354 315 $ US |
| 2004 | 1 632 941 133 $ US | 203 594 899 $ US |
| 2003 | 1 603 024 427 $ US | 159 492 039 $ US |
| 2002 | 1 248 516 029 $ US | 133 146 756 $ US |
| 2001 | 852 678 483 $ US | 93 075 478 $ US |
| 2000 | 914 366 134 $ US | 122 801 162 $ US |
| 1999 | 748 884 130 $ US | 127 116 487 $ US |
| 1998 | 576 760 519 $ US | 118 535 051 $ US |
| 1997 | 711 321 497 $ US | 98 305 132 $ US |
| 1996 | 918 954 282 $ US | 76 166 933 $ US |
| 1995 | 887 180 814 $ US | 47 951 938 $ US |
| 1994 | 771 186 075 $ US | 31 220 396 $ US |
| 1993 | 781 068 454 $ US | 26 149 829 $ US |
| 1992 | 840 552 501 $ US | 28 193 755 $ US |
| 1991 | 914 948 851 $ US | 23 468 609 $ US |
| 1990 | 761 194 246 $ US | 24 378 453 $ US |
| 1989 | 542 375 455 $ US | 24 766 283 $ US |
| 1988 | 463 213 985 $ US | 21 586 914 $ US |
| 1987 | 361 672 163 $ US | 8 194 187 $ US |
| 1986 | 150 724 974 $ US | 6 914 464 $ US |
| 1985 | 42 240 121 $ US | 4 591 968 $ US |
| 1984 | 35 170 101 $ US | 5 129 802 $ US |
| 1983 | 32 229 096 $ US | 4 541 130 $ US |
| 1982 | 55 135 754 $ US | 8 406 398 $ US |
| 1981 | 50 005 948 $ US | 1 145 419 $ US |
| 1980 | 112 825 200 $ US | 949 149 $ US |
| 1979 | 48 428 426 $ US | 712 506 $ US |
| 1978 | 53 255 929 $ US | 571 475 $ US |
| 1977 | 67 871 962 $ US | 80 000 $ US |
| 1976 | 89 513 782 $ US | 10 000 $ US |
| 1975 | 165 977 215 $ US | - |
| 1974 | 131 073 693 $ US | - |
| 1973 | 66 825 994 $ US | - |
| 1972 | 70 118 316 $ US | - |
| 1971 | 51 697 737 $ US | - |
| 1970 | 46 190 000 $ US | - |
| 1969 | 33 050 000 $ US | - |
| 1968 | 16 340 000 $ US | - |
| 1967 | 13 280 000 $ US | - |
| 1966 | 19 280 000 $ US | - |
| 1965 | 19 950 000 $ US | - |
| 1964 | 19 090 000 $ US | - |
| 1963 | 19 370 000 $ US | - |
| 1962 | 18 550 000 $ US | - |
| 1961 | 18 340 000 $ US | - |
| 1960 | 17 120 000 $ US | - |
En 2025, les réserves de change de Maurice s'élevaient à 10,3 milliards de dollars et celles des Maldives à 985 millions de dollars : celles de Maurice étaient 10 fois plus élevées. En 1976, les réserves de Maurice étaient 9 000 fois plus élevées : 89,5 millions de dollars pour Maurice et 10 000 dollars pour les Maldives.
Les réserves de change de Maurice sont supérieures à celles des Maldives chaque année depuis 1976.
Maurice vs Maldives : réserves, or compris, et mois d'importations couverts
|
Maurice
|
Maldives
|
|
|---|---|---|
| Réserves, or compris | 10,3 Md $US | 985 M $US |
| Mois d'importations | 10,2 (2025) | 1,5 (2024) |
| Rang mondial | 77/168 | 138/168 |
| Écart des réserves | 10× | 0,096× |
Comparer les réserves de change de 2 pays au choix
Sources :
- Banque mondiale | Économie et croissance (1960–2025, mis à jour en octobre 2026)
Creative Commons Attribution (CC BY) : vous pouvez copier, partager, adapter et réutiliser ce contenu, y compris à des fins commerciales, à condition de citer statistics.wiki et d’indiquer les modifications apportées. Les sources citées ci-dessus peuvent avoir leurs propres conditions de licence.