
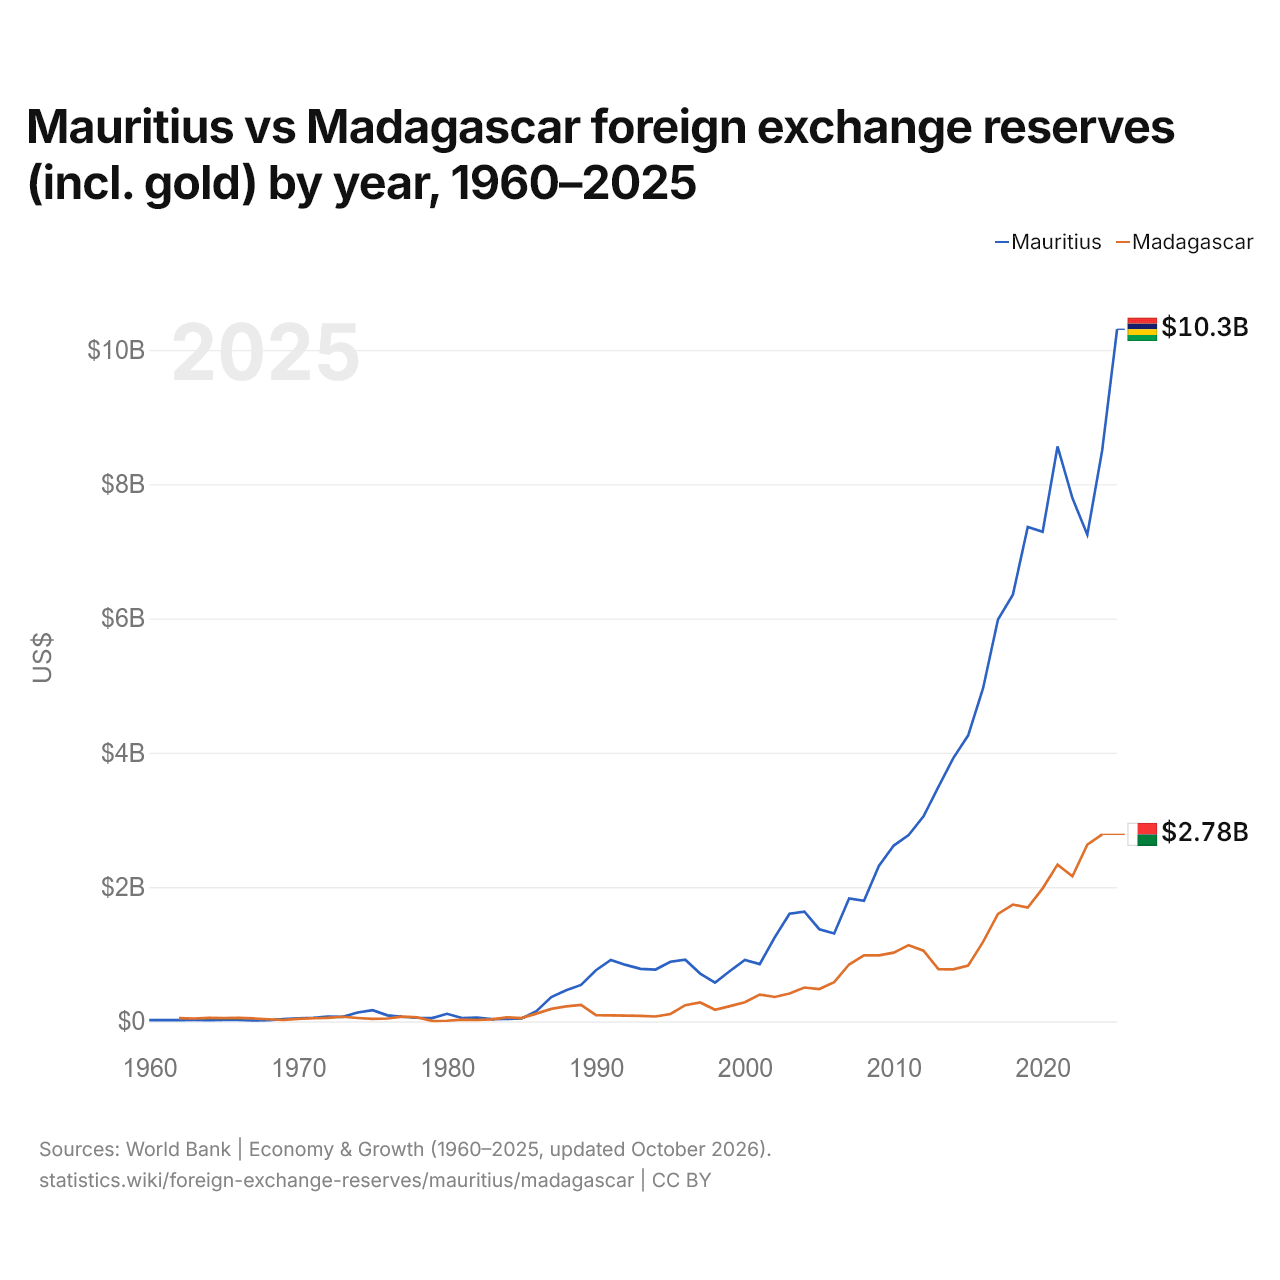
Maurice vs Madagascar : réserves de change (or compris) par année, 1960–2025
| Année | $ US | |
|---|---|---|
 Maurice |
 Madagascar |
|
| 2025 | 10 308 130 279 $ US | - |
| 2024 | 8 506 134 285 $ US | 2 784 591 093 $ US |
| 2023 | 7 247 890 260 $ US | 2 631 980 575 $ US |
| 2022 | 7 792 807 408 $ US | 2 159 914 364 $ US |
| 2021 | 8 562 656 040 $ US | 2 334 564 598 $ US |
| 2020 | 7 291 065 336 $ US | 1 980 766 598 $ US |
| 2019 | 7 362 471 786 $ US | 1 693 147 648 $ US |
| 2018 | 6 353 096 296 $ US | 1 739 588 290 $ US |
| 2017 | 5 984 338 262 $ US | 1 600 175 022 $ US |
| 2016 | 4 962 069 842 $ US | 1 183 690 792 $ US |
| 2015 | 4 259 691 508 $ US | 832 008 813 $ US |
| 2014 | 3 920 880 590 $ US | 773 817 323 $ US |
| 2013 | 3 490 767 904 $ US | 776 146 663 $ US |
| 2012 | 3 053 007 539 $ US | 1 052 810 916 $ US |
| 2011 | 2 775 245 693 $ US | 1 134 559 590 $ US |
| 2010 | 2 618 620 803 $ US | 1 022 970 696 $ US |
| 2009 | 2 315 555 503 $ US | 982 078 790 $ US |
| 2008 | 1 796 126 154 $ US | 982 306 553 $ US |
| 2007 | 1 831 736 327 $ US | 846 677 005 $ US |
| 2006 | 1 308 850 537 $ US | 583 182 459 $ US |
| 2005 | 1 371 551 308 $ US | 481 286 831 $ US |
| 2004 | 1 632 941 133 $ US | 503 524 276 $ US |
| 2003 | 1 603 024 427 $ US | 414 272 747 $ US |
| 2002 | 1 248 516 029 $ US | 363 272 346 $ US |
| 2001 | 852 678 483 $ US | 398 349 961 $ US |
| 2000 | 914 366 134 $ US | 285 182 985 $ US |
| 1999 | 748 884 130 $ US | 227 186 729 $ US |
| 1998 | 576 760 519 $ US | 171 378 013 $ US |
| 1997 | 711 321 497 $ US | 281 600 527 $ US |
| 1996 | 918 954 282 $ US | 240 880 919 $ US |
| 1995 | 887 180 814 $ US | 108 960 784 $ US |
| 1994 | 771 186 075 $ US | 71 640 029 $ US |
| 1993 | 781 068 454 $ US | 80 642 850 $ US |
| 1992 | 840 552 501 $ US | 84 427 500 $ US |
| 1991 | 914 948 851 $ US | 88 857 217 $ US |
| 1990 | 761 194 246 $ US | 92 084 945 $ US |
| 1989 | 542 375 455 $ US | 245 265 708 $ US |
| 1988 | 463 213 985 $ US | 223 721 113 $ US |
| 1987 | 361 672 163 $ US | 185 199 306 $ US |
| 1986 | 150 724 974 $ US | 114 524 464 $ US |
| 1985 | 42 240 121 $ US | 48 443 937 $ US |
| 1984 | 35 170 101 $ US | 58 899 721 $ US |
| 1983 | 32 229 096 $ US | 29 225 635 $ US |
| 1982 | 55 135 754 $ US | 19 959 209 $ US |
| 1981 | 50 005 948 $ US | 26 521 652 $ US |
| 1980 | 112 825 200 $ US | 9 100 000 $ US |
| 1979 | 48 428 426 $ US | 5 039 520 $ US |
| 1978 | 53 255 929 $ US | 59 221 296 $ US |
| 1977 | 67 871 962 $ US | 68 920 781 $ US |
| 1976 | 89 513 782 $ US | 42 161 007 $ US |
| 1975 | 165 977 215 $ US | 35 577 006 $ US |
| 1974 | 131 073 693 $ US | 49 408 139 $ US |
| 1973 | 66 825 994 $ US | 67 901 725 $ US |
| 1972 | 70 118 316 $ US | 52 241 643 $ US |
| 1971 | 51 697 737 $ US | 46 345 063 $ US |
| 1970 | 46 190 000 $ US | 37 122 000 $ US |
| 1969 | 33 050 000 $ US | 19 382 000 $ US |
| 1968 | 16 340 000 $ US | 30 582 000 $ US |
| 1967 | 13 280 000 $ US | 42 882 000 $ US |
| 1966 | 19 280 000 $ US | 51 482 000 $ US |
| 1965 | 19 950 000 $ US | 49 882 000 $ US |
| 1964 | 19 090 000 $ US | 51 080 000 $ US |
| 1963 | 19 370 000 $ US | 42 800 000 $ US |
| 1962 | 18 550 000 $ US | 48 000 000 $ US |
| 1961 | 18 340 000 $ US | - |
| 1960 | 17 120 000 $ US | - |
Les réserves de change de Maurice s'élevaient à 8,51 milliards de dollars (2024) et celles de Madagascar à 2,78 milliards de dollars (2024) : celles de Maurice étaient 3,1 fois plus élevées. En 1962, les réserves de Madagascar étaient 2,6 fois plus élevées : 18,6 millions de dollars pour Maurice et 48 millions de dollars pour Madagascar.
Les réserves de change de Maurice sont supérieures à celles de Madagascar chaque année depuis 1986.
Maurice vs Madagascar : réserves, or compris, et mois d'importations couverts
|
Maurice
|
Madagascar
|
|
|---|---|---|
| Réserves, or compris | 10,3 Md $US (2025) | 2,78 Md $US (2024) |
| Mois d'importations | 10,2 (2025) | 5,7 (2024) |
| Rang mondial | 77/168 | 120/168 |
Comparer les réserves de change de 2 pays au choix
Sources :
- Banque mondiale | Économie et croissance (1960–2025, mis à jour en octobre 2026)
Creative Commons Attribution (CC BY) : vous pouvez copier, partager, adapter et réutiliser ce contenu, y compris à des fins commerciales, à condition de citer statistics.wiki et d’indiquer les modifications apportées. Les sources citées ci-dessus peuvent avoir leurs propres conditions de licence.