
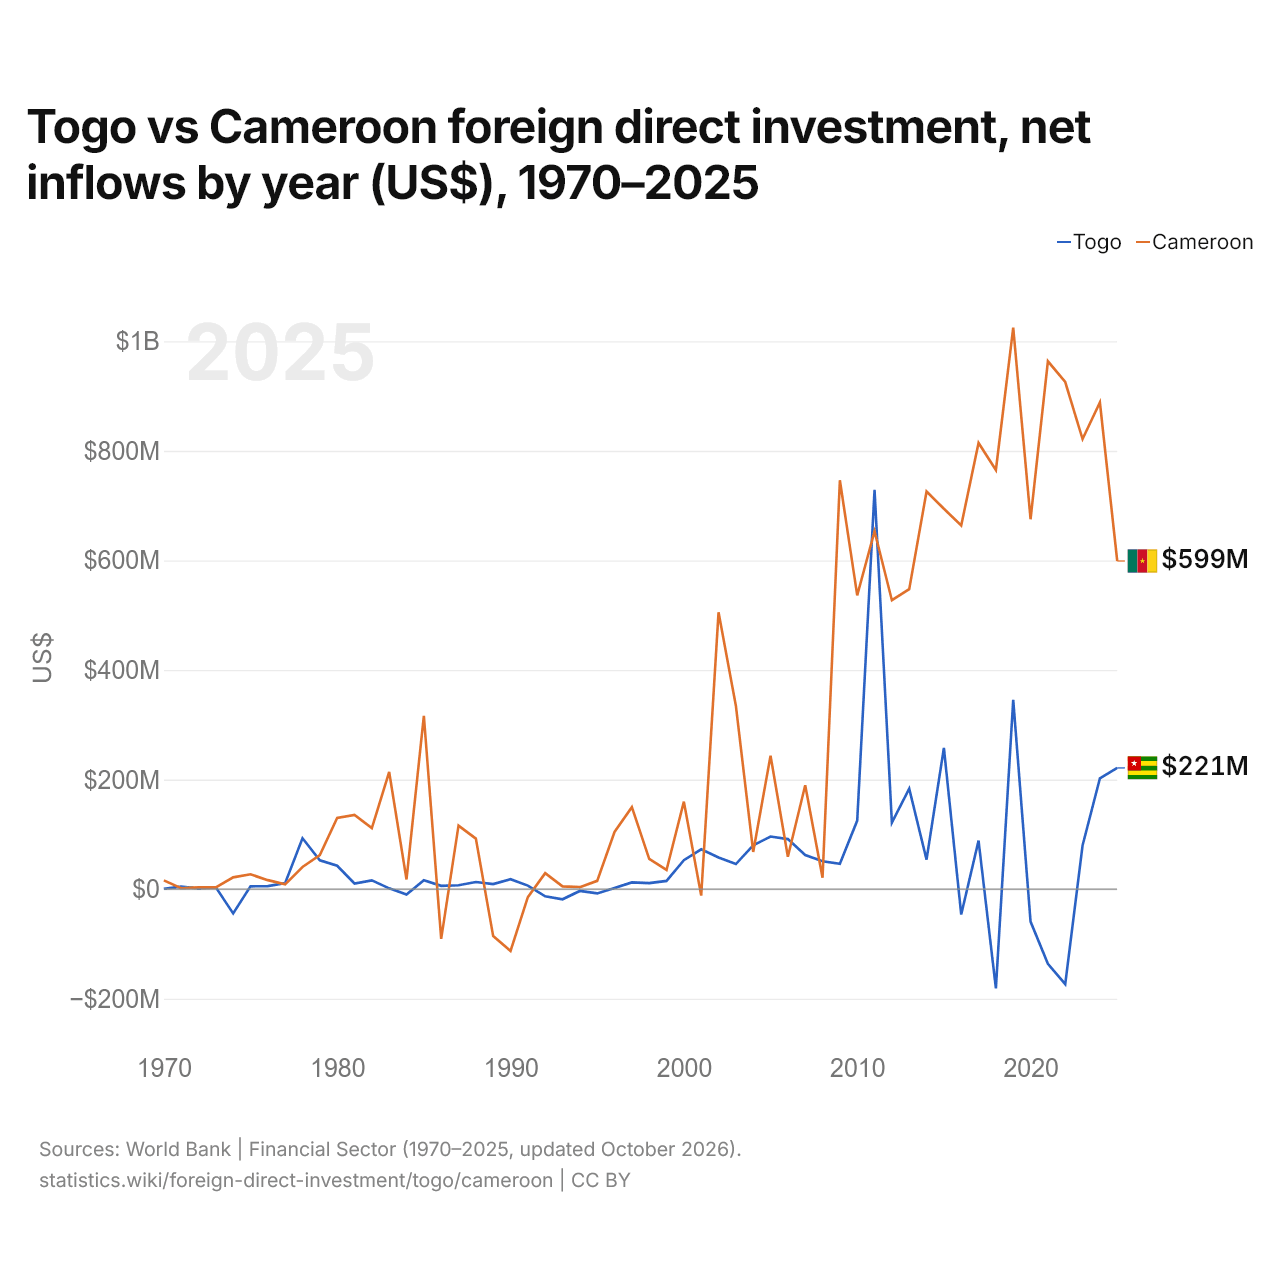
Togo vs Cameroun : investissements directs étrangers, entrées nettes par année ($ US), 1970–2025
| Année | $ US | |
|---|---|---|
 Togo |
 Cameroun |
|
| 2025 | 221 286 729 $ US | 598 949 781 $ US |
| 2024 | 202 262 639 $ US | 888 218 144 $ US |
| 2023 | 79 736 914 $ US | 821 546 383 $ US |
| 2022 | −173 300 712 $ US | 925 681 549 $ US |
| 2021 | −136 221 499 $ US | 963 531 503 $ US |
| 2020 | −59 206 820 $ US | 675 186 994 $ US |
| 2019 | 345 697 547 $ US | 1 024 779 238 $ US |
| 2018 | −180 972 715 $ US | 765 092 013 $ US |
| 2017 | 88 558 700 $ US | 814 458 941 $ US |
| 2016 | −46 308 332 $ US | 663 893 595 $ US |
| 2015 | 257 860 036 $ US | 694 336 735 $ US |
| 2014 | 54 020 342 $ US | 725 854 541 $ US |
| 2013 | 183 599 249 $ US | 547 404 750 $ US |
| 2012 | 121 511 566 $ US | 527 363 936 $ US |
| 2011 | 728 710 878 $ US | 653 266 627 $ US |
| 2010 | 125 064 102 $ US | 536 265 313 $ US |
| 2009 | 46 304 496 $ US | 746 276 649 $ US |
| 2008 | 50 892 372 $ US | 20 995 514 $ US |
| 2007 | 62 406 803 $ US | 189 581 295 $ US |
| 2006 | 91 396 742 $ US | 59 122 291 $ US |
| 2005 | 96 003 598 $ US | 243 601 637 $ US |
| 2004 | 79 967 682 $ US | 67 984 856 $ US |
| 2003 | 45 773 612 $ US | 334 888 536 $ US |
| 2002 | 57 806 307 $ US | 505 256 043 $ US |
| 2001 | 72 617 651 $ US | −11 668 387 $ US |
| 2000 | 52 818 331 $ US | 159 708 006 $ US |
| 1999 | 15 089 199 $ US | 35 009 802 $ US |
| 1998 | 11 116 163 $ US | 55 231 294 $ US |
| 1997 | 12 260 366 $ US | 149 614 498 $ US |
| 1996 | 2 253 923 $ US | 104 417 058 $ US |
| 1995 | −7 813 307 $ US | 15 105 727 $ US |
| 1994 | −3 265 462 $ US | 3 674 321 $ US |
| 1993 | −18 575 901 $ US | 5 120 733 $ US |
| 1992 | −13 109 576 $ US | 29 203 776 $ US |
| 1991 | 6 479 813 $ US | −14 498 050 $ US |
| 1990 | 18 239 597 $ US | −112 831 337 $ US |
| 1989 | 9 169 040 $ US | −85 734 447 $ US |
| 1988 | 12 966 336 $ US | 92 362 479 $ US |
| 1987 | 7 150 544 $ US | 115 925 995 $ US |
| 1986 | 6 113 092 $ US | −90 700 158 $ US |
| 1985 | 16 275 546 $ US | 316 229 050 $ US |
| 1984 | −9 936 912 $ US | 17 667 656 $ US |
| 1983 | 1 443 319 $ US | 213 821 208 $ US |
| 1982 | 16 131 769 $ US | 111 440 363 $ US |
| 1981 | 10 193 888 $ US | 135 391 025 $ US |
| 1980 | 42 734 849 $ US | 129 827 990 $ US |
| 1979 | 52 585 152 $ US | 62 099 934 $ US |
| 1978 | 92 893 666 $ US | 40 548 471 $ US |
| 1977 | 11 258 562 $ US | 8 710 529 $ US |
| 1976 | 5 624 596 $ US | 16 400 000 $ US |
| 1975 | 5 212 005 $ US | 27 100 000 $ US |
| 1974 | −44 328 181 $ US | 21 600 000 $ US |
| 1973 | 3 300 000 $ US | 3 100 000 $ US |
| 1972 | 1 200 000 $ US | 3 300 000 $ US |
| 1971 | 4 600 000 $ US | 1 700 000 $ US |
| 1970 | 700 000 $ US | 16 000 000 $ US |
En 2025, les entrées nettes d'investissements directs étrangers étaient de 221 millions de dollars au Togo et de 599 millions de dollars au Cameroun : 2,7 fois plus au Cameroun. En 1970, elles étaient de 700 000 dollars au Togo et de 16 millions de dollars au Cameroun.
Les entrées nettes d'investissements directs étrangers au Togo ont été supérieures à celles du Cameroun pendant 13 des 56 années de 1970 à 2025, et inférieures pendant 43.
Togo vs Cameroun : dernières entrées et sorties d'investissements étrangers
|
Togo
|
Cameroun
|
|
|---|---|---|
| Entrées nettes | +221 M $US | +599 M $US |
| Entrées nettes, % du PIB | +1,9 % | +1,0 % |
| Sorties nettes | +189 M $US | +6,89 M $US |
| Entrées nettes, total 2016–2025 | +342 M $US | +8,14 Md $US |
| Rang mondial | 136/192 | 112/192 |
Comparer les investissements directs étrangers de 2 pays au choix
Sources :
- Banque mondiale | Secteur financier (1970–2025, mis à jour en octobre 2026)
Creative Commons Attribution (CC BY) : vous pouvez copier, partager, adapter et réutiliser ce contenu, y compris à des fins commerciales, à condition de citer statistics.wiki et d’indiquer les modifications apportées. Les sources citées ci-dessus peuvent avoir leurs propres conditions de licence.