
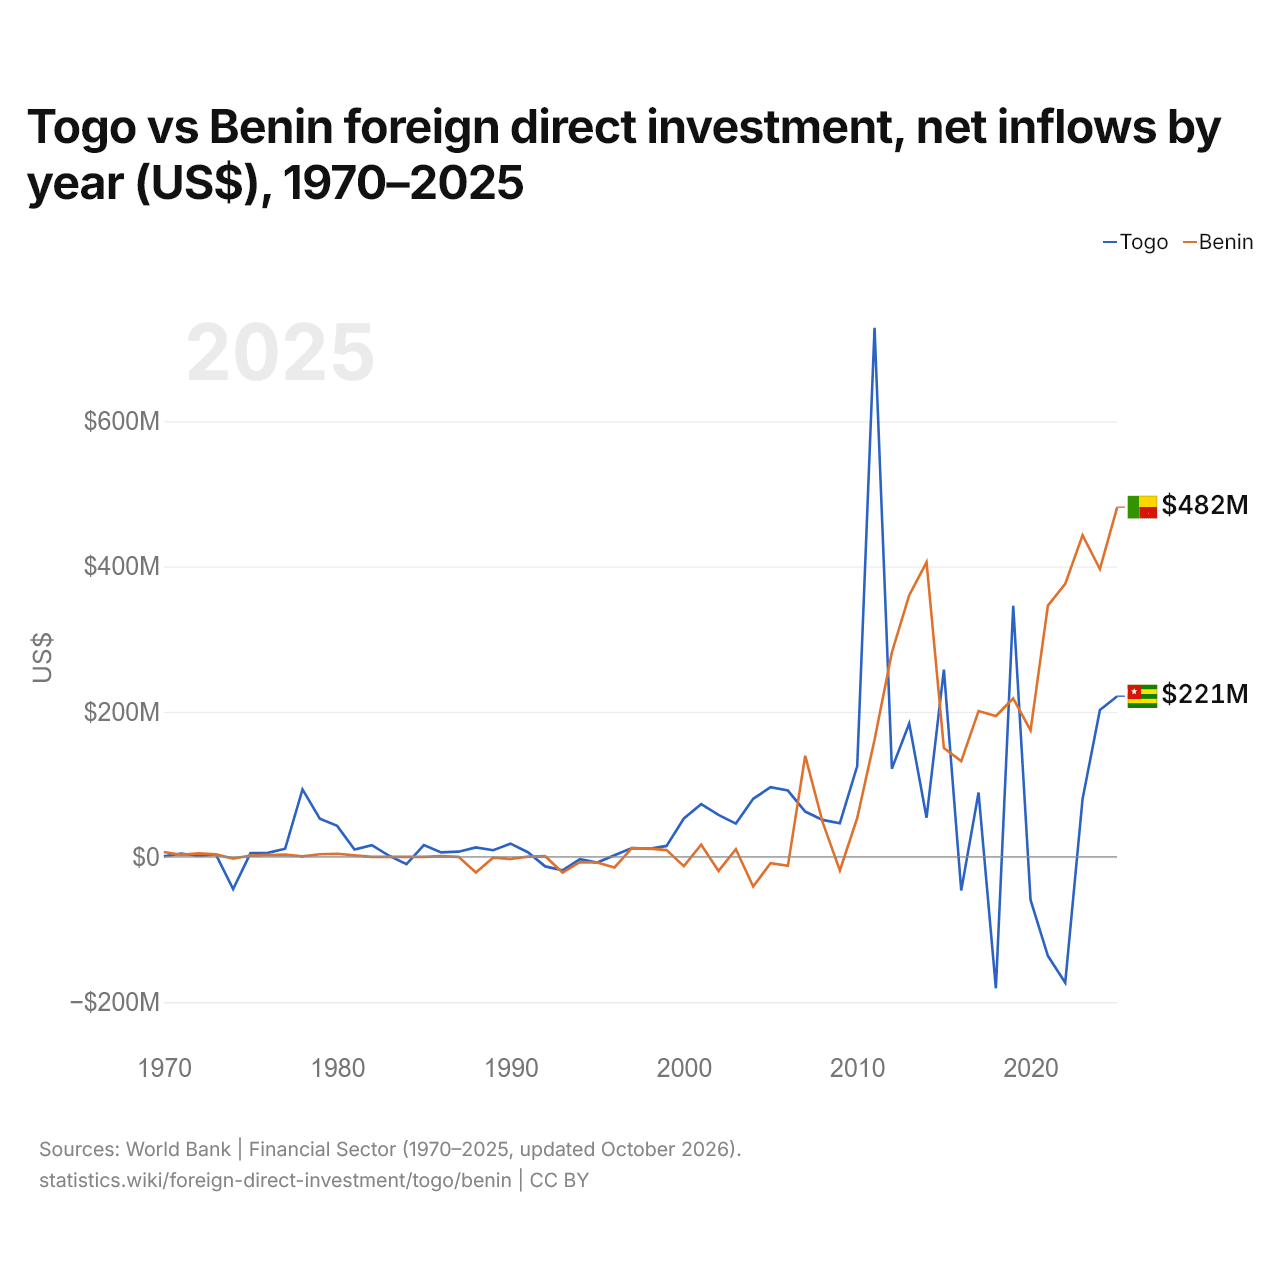
Togo vs Bénin : investissements directs étrangers, entrées nettes par année ($ US), 1970–2025
| Année | $ US | |
|---|---|---|
 Togo |
 Bénin |
|
| 2025 | 221 286 729 $ US | 481 660 038 $ US |
| 2024 | 202 262 639 $ US | 396 390 573 $ US |
| 2023 | 79 736 914 $ US | 442 960 064 $ US |
| 2022 | −173 300 712 $ US | 375 988 902 $ US |
| 2021 | −136 221 499 $ US | 345 985 236 $ US |
| 2020 | −59 206 820 $ US | 174 019 952 $ US |
| 2019 | 345 697 547 $ US | 218 207 872 $ US |
| 2018 | −180 972 715 $ US | 194 073 683 $ US |
| 2017 | 88 558 700 $ US | 200 902 719 $ US |
| 2016 | −46 308 332 $ US | 131 790 854 $ US |
| 2015 | 257 860 036 $ US | 149 755 663 $ US |
| 2014 | 54 020 342 $ US | 405 737 369 $ US |
| 2013 | 183 599 249 $ US | 360 343 380 $ US |
| 2012 | 121 511 566 $ US | 281 548 556 $ US |
| 2011 | 728 710 878 $ US | 161 302 391 $ US |
| 2010 | 125 064 102 $ US | 53 507 088 $ US |
| 2009 | 46 304 496 $ US | −18 807 407 $ US |
| 2008 | 50 892 372 $ US | 48 210 758 $ US |
| 2007 | 62 406 803 $ US | 139 189 943 $ US |
| 2006 | 91 396 742 $ US | −12 363 482 $ US |
| 2005 | 96 003 598 $ US | −8 788 860 $ US |
| 2004 | 79 967 682 $ US | −40 774 605 $ US |
| 2003 | 45 773 612 $ US | 10 638 088 $ US |
| 2002 | 57 806 307 $ US | −19 395 623 $ US |
| 2001 | 72 617 651 $ US | 16 739 539 $ US |
| 2000 | 52 818 331 $ US | −12 794 844 $ US |
| 1999 | 15 089 199 $ US | 9 314 782 $ US |
| 1998 | 11 116 163 $ US | 11 294 143 $ US |
| 1997 | 12 260 366 $ US | 12 183 267 $ US |
| 1996 | 2 253 923 $ US | −14 661 254 $ US |
| 1995 | −7 813 307 $ US | −7 738 380 $ US |
| 1994 | −3 265 462 $ US | −7 107 469 $ US |
| 1993 | −18 575 901 $ US | −21 635 980 $ US |
| 1992 | −13 109 576 $ US | 954 317 $ US |
| 1991 | 6 479 813 $ US | 393 822 $ US |
| 1990 | 18 239 597 $ US | −2 954 844 $ US |
| 1989 | 9 169 040 $ US | −1 118 466 $ US |
| 1988 | 12 966 336 $ US | −21 662 040 $ US |
| 1987 | 7 150 544 $ US | 100 000 $ US |
| 1986 | 6 113 092 $ US | 1 100 000 $ US |
| 1985 | 16 275 546 $ US | −90 000 $ US |
| 1984 | −9 936 912 $ US | 11 443 $ US |
| 1983 | 1 443 319 $ US | 10 497 $ US |
| 1982 | 16 131 769 $ US | −12 173 $ US |
| 1981 | 10 193 888 $ US | 2 090 299 $ US |
| 1980 | 42 734 849 $ US | 4 316 556 $ US |
| 1979 | 52 585 152 $ US | 3 568 043 $ US |
| 1978 | 92 893 666 $ US | 753 360 $ US |
| 1977 | 11 258 562 $ US | 3 126 022 $ US |
| 1976 | 5 624 596 $ US | 2 452 391 $ US |
| 1975 | 5 212 005 $ US | 1 889 760 $ US |
| 1974 | −44 328 181 $ US | −2 343 120 $ US |
| 1973 | 3 300 000 $ US | 3 500 000 $ US |
| 1972 | 1 200 000 $ US | 4 800 000 $ US |
| 1971 | 4 600 000 $ US | 2 800 000 $ US |
| 1970 | 700 000 $ US | 6 700 000 $ US |
En 2025, les entrées nettes d'investissements directs étrangers étaient de 221 millions de dollars au Togo et de 482 millions de dollars au Bénin : 2,2 fois plus au Bénin. En 1970, elles étaient de 700 000 dollars au Togo et de 6,7 millions de dollars au Bénin.
Les entrées nettes d'investissements directs étrangers au Togo ont été supérieures à celles du Bénin pendant 35 des 56 années de 1970 à 2025, et inférieures pendant 21. Les entrées nettes au Togo et au Bénin ont été négatives (désinvestissement) en même temps pendant 4 de ces années, la dernière fois en 1995.
Togo vs Bénin : dernières entrées et sorties d'investissements étrangers
|
Togo
|
Bénin
|
|
|---|---|---|
| Entrées nettes | +221 M $US | +482 M $US |
| Entrées nettes, % du PIB | +1,9 % | +2,0 % |
| Sorties nettes | +189 M $US | +53,2 M $US |
| Entrées nettes, total 2016–2025 | +342 M $US | +2,96 Md $US |
| Rang mondial | 136/192 | 117/192 |
Comparer les investissements directs étrangers de 2 pays au choix
Sources :
- Banque mondiale | Secteur financier (1970–2025, mis à jour en octobre 2026)
Creative Commons Attribution (CC BY) : vous pouvez copier, partager, adapter et réutiliser ce contenu, y compris à des fins commerciales, à condition de citer statistics.wiki et d’indiquer les modifications apportées. Les sources citées ci-dessus peuvent avoir leurs propres conditions de licence.