
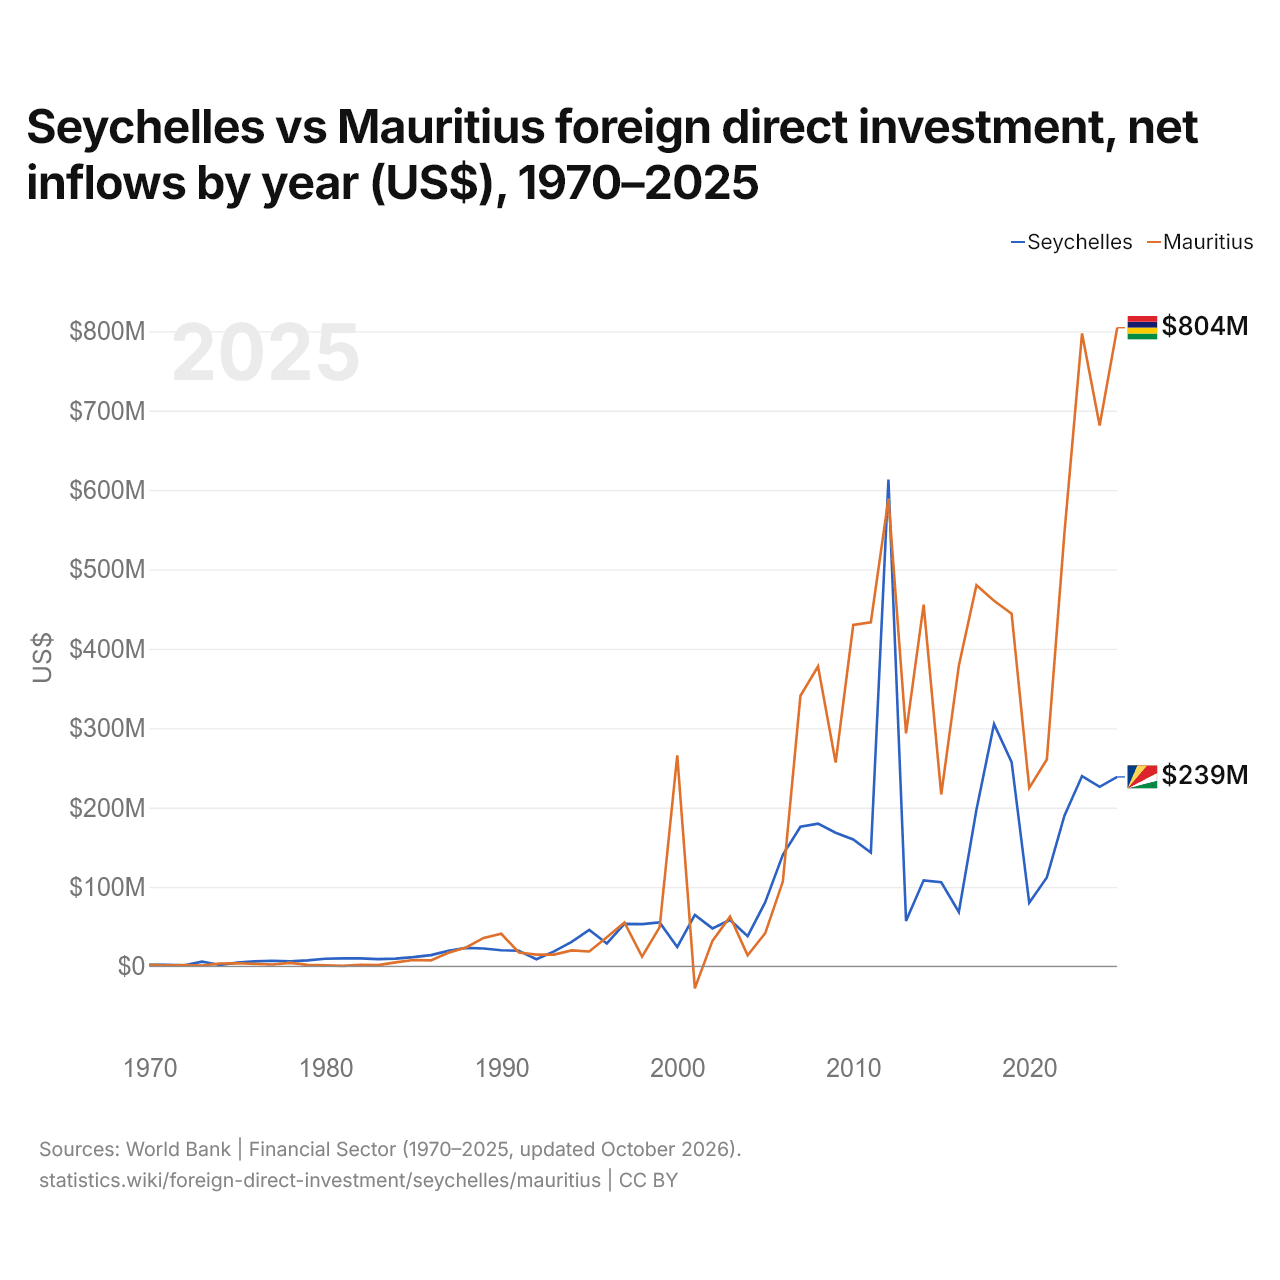
Seychelles vs Maurice : investissements directs étrangers, entrées nettes par année ($ US), 1970–2025
| Année | $ US | |
|---|---|---|
 Seychelles |
 Maurice |
|
| 2025 | 238 585 041 $ US | 804 429 140 $ US |
| 2024 | 226 134 114 $ US | 681 276 232 $ US |
| 2023 | 239 706 294 $ US | 797 161 197 $ US |
| 2022 | 189 827 389 $ US | 545 909 423 $ US |
| 2021 | 111 955 764 $ US | 260 543 727 $ US |
| 2020 | 80 053 481 $ US | 224 668 083 $ US |
| 2019 | 257 086 352 $ US | 444 077 761 $ US |
| 2018 | 305 172 394 $ US | 460 511 368 $ US |
| 2017 | 197 311 244 $ US | 479 995 890 $ US |
| 2016 | 68 346 744 $ US | 378 764 432 $ US |
| 2015 | 105 893 597 $ US | 216 455 188 $ US |
| 2014 | 108 355 443 $ US | 455 562 152 $ US |
| 2013 | 57 289 066 $ US | 293 369 157 $ US |
| 2012 | 613 208 776 $ US | 589 018 303 $ US |
| 2011 | 143 240 665 $ US | 433 331 011 $ US |
| 2010 | 159 795 375 $ US | 429 941 789 $ US |
| 2009 | 168 251 662 $ US | 256 680 712 $ US |
| 2008 | 179 825 444 $ US | 377 724 738 $ US |
| 2007 | 175 923 647 $ US | 340 763 854 $ US |
| 2006 | 140 555 693 $ US | 106 758 059 $ US |
| 2005 | 80 729 739 $ US | 41 776 996 $ US |
| 2004 | 38 014 852 $ US | 13 894 736 $ US |
| 2003 | 58 425 541 $ US | 62 630 665 $ US |
| 2002 | 47 717 748 $ US | 32 073 116 $ US |
| 2001 | 64 740 257 $ US | −27 675 566 $ US |
| 2000 | 24 326 997 $ US | 265 641 239 $ US |
| 1999 | 55 216 733 $ US | 49 353 191 $ US |
| 1998 | 53 209 768 $ US | 12 170 394 $ US |
| 1997 | 53 398 678 $ US | 55 277 852 $ US |
| 1996 | 28 812 974 $ US | 36 661 330 $ US |
| 1995 | 45 884 323 $ US | 18 692 861 $ US |
| 1994 | 30 736 621 $ US | 19 988 456 $ US |
| 1993 | 18 836 123 $ US | 14 732 527 $ US |
| 1992 | 9 014 031 $ US | 14 714 190 $ US |
| 1991 | 19 582 924 $ US | 17 377 629 $ US |
| 1990 | 20 239 899 $ US | 41 040 224 $ US |
| 1989 | 22 429 117 $ US | 35 803 827 $ US |
| 1988 | 23 202 323 $ US | 23 739 137 $ US |
| 1987 | 19 404 469 $ US | 17 160 761 $ US |
| 1986 | 14 197 370 $ US | 7 425 913 $ US |
| 1985 | 11 646 628 $ US | 7 965 040 $ US |
| 1984 | 9 773 109 $ US | 4 927 417 $ US |
| 1983 | 9 122 965 $ US | 1 623 072 $ US |
| 1982 | 10 014 686 $ US | 1 747 520 $ US |
| 1981 | 10 069 846 $ US | 671 401 $ US |
| 1980 | 9 519 567 $ US | 1 171 221 $ US |
| 1979 | 7 506 482 $ US | 1 743 787 $ US |
| 1978 | 6 328 689 $ US | 4 380 788 $ US |
| 1977 | 7 064 934 $ US | 2 270 213 $ US |
| 1976 | 6 335 185 $ US | 3 142 995 $ US |
| 1975 | 4 580 000 $ US | 3 900 000 $ US |
| 1974 | 1 730 000 $ US | 3 610 000 $ US |
| 1973 | 5 840 000 $ US | 1 020 000 $ US |
| 1972 | 1 350 000 $ US | 1 560 000 $ US |
| 1971 | 1 810 000 $ US | 1 300 000 $ US |
| 1970 | 2 200 000 $ US | 1 600 000 $ US |
En 2025, les entrées nettes d'investissements directs étrangers étaient de 239 millions de dollars aux Seychelles et de 804 millions de dollars à Maurice : 3,4 fois plus à Maurice. En 1970, elles étaient de 2,2 millions de dollars aux Seychelles et de 1,6 million de dollars à Maurice.
Les entrées nettes d'investissements directs étrangers aux Seychelles ont été supérieures à celles de Maurice pendant 28 des 56 années de 1970 à 2025, et inférieures pendant 28.
Seychelles vs Maurice : dernières entrées et sorties d'investissements étrangers
|
Seychelles
|
Maurice
|
|
|---|---|---|
| Entrées nettes | +239 M $US | +804 M $US |
| Entrées nettes, % du PIB | +10,0 % | +5,0 % |
| Sorties nettes | −47,3 M $US | +22,4 M $US |
| Entrées nettes, total 2016–2025 | +1,91 Md $US | +5,08 Md $US |
| Rang mondial | 135/192 | 104/192 |
Comparer les investissements directs étrangers de 2 pays au choix
Sources :
- Banque mondiale | Secteur financier (1970–2025, mis à jour en octobre 2026)
Creative Commons Attribution (CC BY) : vous pouvez copier, partager, adapter et réutiliser ce contenu, y compris à des fins commerciales, à condition de citer statistics.wiki et d’indiquer les modifications apportées. Les sources citées ci-dessus peuvent avoir leurs propres conditions de licence.