
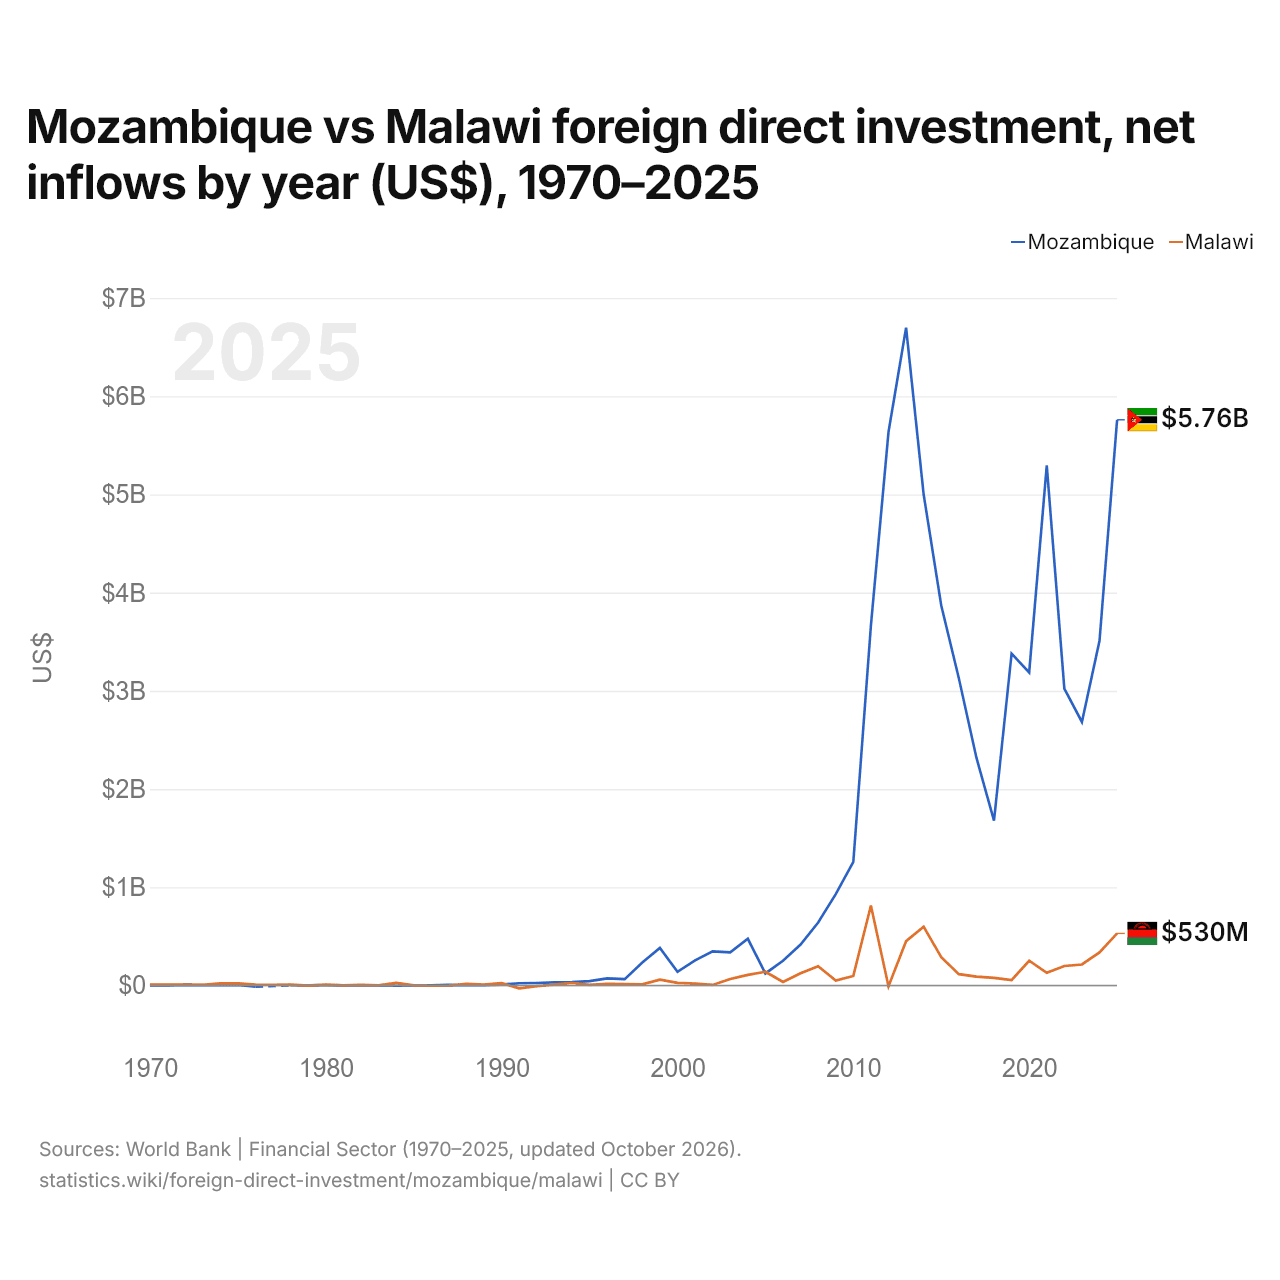
Mozambique vs Malawi : investissements directs étrangers, entrées nettes par année ($ US), 1970–2025
| Année | $ US | |
|---|---|---|
 Mozambique |
 Malawi |
|
| 2025 | 5 759 712 544 $ US | 530 135 889 $ US |
| 2024 | 3 508 626 212 $ US | 336 630 000 $ US |
| 2023 | 2 683 506 271 $ US | 213 960 520 $ US |
| 2022 | 3 022 175 565 $ US | 198 726 519 $ US |
| 2021 | 5 295 396 105 $ US | 129 497 085 $ US |
| 2020 | 3 187 942 207 $ US | 252 179 040 $ US |
| 2019 | 3 379 329 136 $ US | 55 227 832 $ US |
| 2018 | 1 678 061 192 $ US | 77 012 306 $ US |
| 2017 | 2 319 071 971 $ US | 90 200 000 $ US |
| 2016 | 3 128 149 929 $ US | 115 700 000 $ US |
| 2015 | 3 868 353 885 $ US | 287 746 689 $ US |
| 2014 | 4 998 799 334 $ US | 598 086 538 $ US |
| 2013 | 6 697 422 432 $ US | 451 362 407 $ US |
| 2012 | 5 635 092 659 $ US | −8 885 976 $ US |
| 2011 | 3 663 937 118 $ US | 812 751 770 $ US |
| 2010 | 1 258 453 097 $ US | 97 010 559 $ US |
| 2009 | 930 100 408 $ US | 49 130 371 $ US |
| 2008 | 641 399 416 $ US | 195 425 887 $ US |
| 2007 | 416 689 348 $ US | 124 388 649 $ US |
| 2006 | 251 141 650 $ US | 35 561 804 $ US |
| 2005 | 122 413 756 $ US | 139 696 403 $ US |
| 2004 | 475 513 573 $ US | 107 811 374 $ US |
| 2003 | 336 698 401 $ US | 65 885 630 $ US |
| 2002 | 347 252 831 $ US | 5 899 999 $ US |
| 2001 | 255 435 491 $ US | 19 299 991 $ US |
| 2000 | 139 300 000 $ US | 25 999 996 $ US |
| 1999 | 381 700 000 $ US | 58 528 206 $ US |
| 1998 | 234 900 000 $ US | 12 104 230 $ US |
| 1997 | 64 400 000 $ US | 14 868 714 $ US |
| 1996 | 72 500 000 $ US | 15 797 661 $ US |
| 1995 | 45 000 000 $ US | 5 643 046 $ US |
| 1994 | 35 000 000 $ US | 24 992 618 $ US |
| 1993 | 32 000 000 $ US | 8 000 000 $ US |
| 1992 | 25 300 000 $ US | −7 100 000 $ US |
| 1991 | 22 500 000 $ US | −28 700 000 $ US |
| 1990 | 9 200 000 $ US | 23 300 000 $ US |
| 1989 | 3 400 000 $ US | 9 290 000 $ US |
| 1988 | 4 500 000 $ US | 17 440 000 $ US |
| 1987 | 6 200 000 $ US | 90 549 $ US |
| 1986 | 1 500 000 $ US | −2 930 000 $ US |
| 1985 | 330 000 $ US | 523 531 $ US |
| 1984 | −2 920 000 $ US | 27 290 000 $ US |
| 1983 | 2 470 000 $ US | 2 553 706 $ US |
| 1982 | 1 930 000 $ US | 6 000 000 $ US |
| 1981 | 370 000 $ US | 1 116 945 $ US |
| 1980 | 4 360 000 $ US | 9 481 642 $ US |
| 1979 | 2 430 000 $ US | −1 224 173 $ US |
| 1978 | 2 000 000 $ US | 9 125 979 $ US |
| 1977 | - | 5 537 540 $ US |
| 1976 | −12 640 000 $ US | 9 700 000 $ US |
| 1975 | 6 670 000 $ US | 22 110 000 $ US |
| 1974 | 2 000 000 $ US | 22 700 000 $ US |
| 1973 | 4 020 000 $ US | 7 700 000 $ US |
| 1972 | 5 500 000 $ US | 10 100 000 $ US |
| 1971 | 30 000 $ US | 9 600 000 $ US |
| 1970 | 300 000 $ US | 8 600 000 $ US |
En 2025, les entrées nettes d'investissements directs étrangers étaient de 5,76 milliards de dollars au Mozambique et de 530 millions de dollars au Malawi : 11 fois plus au Mozambique. En 1970, elles étaient de 300 000 dollars au Mozambique et de 8,6 millions de dollars au Malawi.
Les entrées nettes d'investissements directs étrangers au Mozambique ont été supérieures à celles du Malawi pendant 37 des 55 années de 1970 à 2025 que les deux pays ont communiquées, et inférieures pendant 18.
Mozambique vs Malawi : dernières entrées et sorties d'investissements étrangers
|
Mozambique
|
Malawi
|
|
|---|---|---|
| Entrées nettes | +5,76 Md $US | +530 M $US |
| Entrées nettes, % du PIB | +25,8 % | +3,6 % |
| Sorties nettes | +66,7 M $US | +44,6 M $US |
| Entrées nettes, total 2016–2025 | +34,0 Md $US | +2,00 Md $US |
| Rang mondial | 43/192 | 114/192 |
Comparer les investissements directs étrangers de 2 pays au choix
Sources :
- Banque mondiale | Secteur financier (1970–2025, mis à jour en octobre 2026)
Creative Commons Attribution (CC BY) : vous pouvez copier, partager, adapter et réutiliser ce contenu, y compris à des fins commerciales, à condition de citer statistics.wiki et d’indiquer les modifications apportées. Les sources citées ci-dessus peuvent avoir leurs propres conditions de licence.