
Mozambique vs Malawi : PIB, 1980–2025
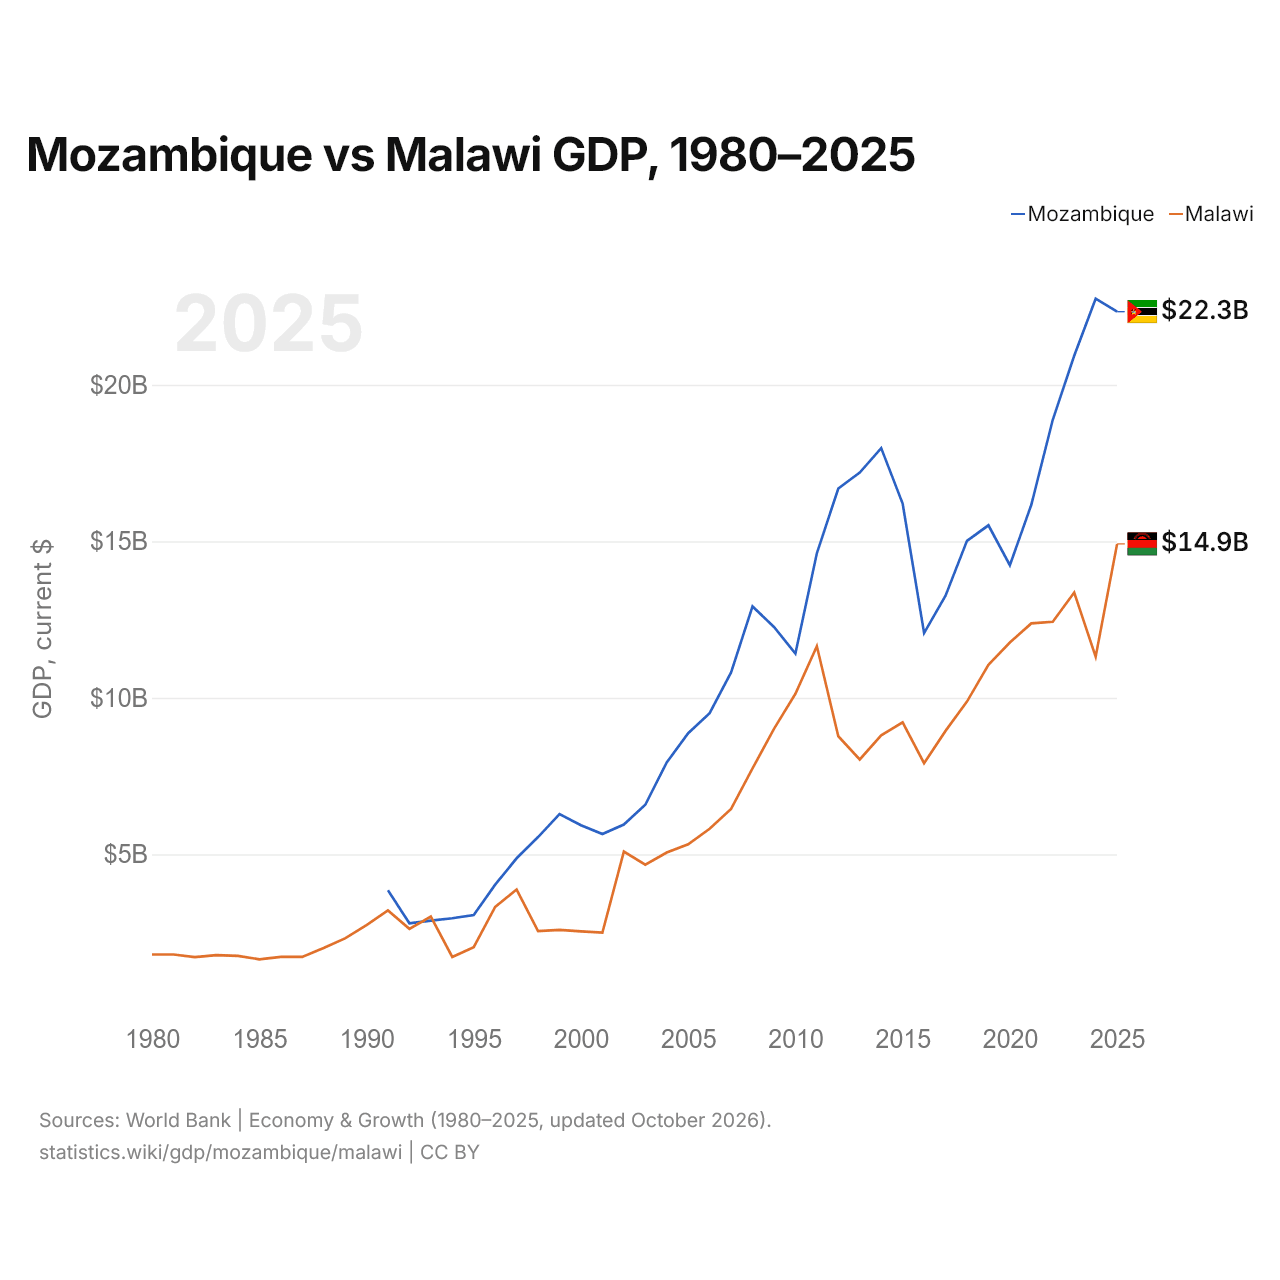
| Année | PIB, dollars US courants | |
|---|---|---|
 Mozambique |
 Malawi |
|
| 2025 | 22 337 997 046 $ US | 14 918 276 698 $ US |
| 2024 | 22 752 244 245 $ US | 11 311 971 400 $ US |
| 2023 | 20 927 498 317 $ US | 13 363 669 673 $ US |
| 2022 | 18 884 232 599 $ US | 12 429 059 928 $ US |
| 2021 | 16 168 055 475 $ US | 12 378 119 199 $ US |
| 2020 | 14 235 420 174 $ US | 11 769 313 598 $ US |
| 2019 | 15 512 759 047 $ US | 11 051 852 713 $ US |
| 2018 | 15 017 358 953 $ US | 9 879 220 354 $ US |
| 2017 | 13 264 640 646 $ US | 8 943 543 794 $ US |
| 2016 | 12 069 051 237 $ US | 7 909 868 618 $ US |
| 2015 | 16 208 985 770 $ US | 9 219 474 379 $ US |
| 2014 | 17 978 246 586 $ US | 8 801 326 169 $ US |
| 2013 | 17 198 073 057 $ US | 8 031 571 928 $ US |
| 2012 | 16 688 114 144 $ US | 8 773 203 178 $ US |
| 2011 | 14 619 279 989 $ US | 11 648 142 958 $ US |
| 2010 | 11 411 894 724 $ US | 10 128 323 011 $ US |
| 2009 | 12 263 894 790 $ US | 9 009 887 947 $ US |
| 2008 | 12 920 340 965 $ US | 7 743 617 352 $ US |
| 2007 | 10 811 456 006 $ US | 6 451 210 219 $ US |
| 2006 | 9 509 835 537 $ US | 5 818 279 739 $ US |
| 2005 | 8 868 504 900 $ US | 5 320 409 651 $ US |
| 2004 | 7 937 255 565 $ US | 5 058 726 350 $ US |
| 2003 | 6 583 526 861 $ US | 4 669 789 300 $ US |
| 2002 | 5 950 769 427 $ US | 5 087 328 438 $ US |
| 2001 | 5 650 154 067 $ US | 2 498 008 665 $ US |
| 2000 | 5 930 685 215 $ US | 2 537 307 580 $ US |
| 1999 | 6 285 219 691 $ US | 2 584 478 924 $ US |
| 1998 | 5 551 118 149 $ US | 2 547 609 590 $ US |
| 1997 | 4 873 663 775 $ US | 3 875 785 863 $ US |
| 1996 | 4 030 146 135 $ US | 3 319 573 750 $ US |
| 1995 | 3 061 646 174 $ US | 2 033 701 498 $ US |
| 1994 | 2 958 108 170 $ US | 1 719 864 761 $ US |
| 1993 | 2 883 161 897 $ US | 3 013 392 658 $ US |
| 1992 | 2 798 696 511 $ US | 2 618 837 835 $ US |
| 1991 | 3 854 856 435 $ US | 3 206 783 830 $ US |
| 1990 | - | 2 737 087 862 $ US |
| 1989 | - | 2 314 205 130 $ US |
| 1988 | - | 2 008 189 508 $ US |
| 1987 | - | 1 721 711 808 $ US |
| 1986 | - | 1 722 586 299 $ US |
| 1985 | - | 1 646 442 273 $ US |
| 1984 | - | 1 758 028 656 $ US |
| 1983 | - | 1 780 148 049 $ US |
| 1982 | - | 1 717 379 495 $ US |
| 1981 | - | 1 801 193 910 $ US |
| 1980 | - | 1 801 156 775 $ US |
En 2025, le PIB du Mozambique (22,3 milliards de dollars US) était supérieur de 50 % à celui du Malawi (14,9 milliards de dollars US). En 2015, le rapport était de 1,8. De 2015 à 2025, à prix constants de 2015, le PIB du Mozambique a progressé de 28,7 % et celui du Malawi de 32,1 %.
Depuis 1994, le PIB du Mozambique est le plus élevé des deux ; il l'était aussi en 1991, supérieur de 20 % à celui du Malawi. En 2025, le PIB par habitant était de 627 $ US au Mozambique et de 672 $ US au Malawi, soit 7,1 % de plus au Malawi.
Mozambique vs Malawi : derniers chiffres du PIB
|
Mozambique
|
Malawi
|
|
|---|---|---|
| PIB, dollars US courants | 22,3 Md $US | 14,9 Md $US |
| Rang mondial | 127/197 | 148/197 |
| Part mondiale | 0,02 % | 0,01 % |
| PIB, dollars US constants de 2015 | 20,9 Md $US | 12,2 Md $US |
| Écart de PIB | 1,5× | 0,67× |
Comparer le PIB de 2 pays au choix
Sources :
- Banque mondiale | Économie et croissance (1980–2025, mis à jour en octobre 2026)
Creative Commons Attribution (CC BY) : vous pouvez copier, partager, adapter et réutiliser ce contenu, y compris à des fins commerciales, à condition de citer statistics.wiki et d’indiquer les modifications apportées. Les sources citées ci-dessus peuvent avoir leurs propres conditions de licence.