
Déficit (−) ou excédent (+) budgétaire par pays, 2025
| Rang | Pays | % du PIB | $ US | Années de déficit depuis 2000 |
|---|---|---|---|---|
 Monde |
−5,1 % | −5,91 Bn $US | 25 sur 25 | |
| 1 |  Timor oriental |
−46,2 % | −880 M $US | 23 sur 25 |
| 2 |  Libye |
−30,5 % | −14,7 Md $US | 11 |
| 3 |  Brunei |
−17,7 % | −2,66 Md $US | 12 |
| 4 |  Ukraine |
−17,6 % | −37,7 Md $US | 26 |
| 5 |  Kiribati |
−14,5 % | −50,6 M $US | 16 |
| 6 |  Bahreïn |
−13,2 % | −6,44 Md $US | 19 |
| 7 |  Saint-Vincent |
−13,0 % | −163 M $US | 25 |
| 8 |  Gabon |
−12,1 % | −2,60 Md $US | 10 |
| 9 |  Saint-Christophe |
−11,8 % | −139 M $US | 16 |
| 10 |  Bolivie |
−11,4 % | −7,36 Md $US | 19 |
| 11 |  Algérie |
−10,5 % | −30,1 Md $US | 17 |
| 12 |  Malawi |
−10,2 % | −1,53 Md $US | 23 sur 24 |
| 13 |  Suriname |
−8,3 % | −378 M $US | 20 |
| 14 |  Chine |
−7,9 % | −1,53 Bn $US | 25 |
| 15 |  Eswatini |
−7,8 % | −401 M $US | 21 |
| 16 |  Roumanie |
−7,6 % | −32,7 Md $US | 26 |
| 17 |  Brésil |
−7,4 % | −169 Md $US | 25 sur 25 |
| 18 |  Inde |
−7,4 % | −291 Md $US | 26 |
| 19 |  Pologne |
−7,3 % | −75,2 Md $US | 26 |
| 20 |  États-Unis |
−7,1 % | −2,17 Bn $US | 25 sur 25 |
| 21 |  Guinée-Bissau |
−6,7 % | −169 M $US | 25 |
| 22 |  Ouganda |
−6,6 % | −4,09 Md $US | 25 |
| 23 |  Égypte |
−6,6 % | −23,9 Md $US | 25 |
| 24 |  Kenya |
−6,5 % | −8,82 Md $US | 24 |
| 25 |  Sénégal |
−6,4 % | −2,38 Md $US | 23 |
| 26 |  Guinée |
−6,4 % | −1,81 Md $US | 23 |
| 27 |  Irak |
−6,2 % | −15,9 Md $US | 14 sur 22 |
| 28 |  Jordanie |
−6,2 % | −3,80 Md $US | 22 |
| 29 |  Botswana |
−6,1 % | −1,22 Md $US | 16 |
| 30 |  Namibie |
−5,9 % | −892 M $US | 23 |
| 31 |  Arabie saoudite |
−5,8 % | −74,1 Md $US | 14 |
| 32 |  Colombie |
−5,8 % | −26,3 Md $US | 24 |
| 33 |  Afrique du Sud |
−5,6 % | −23,8 Md $US | 24 |
| 34 |  Guyana |
−5,5 % | −1,50 Md $US | 26 |
| 35 |  Trinité-et-Tobago |
−5,4 % | −1,41 Md $US | 17 |
| 36 |  Pakistan |
−5,4 % | −21,9 Md $US | 26 |
| 37 |  Iran |
−5,3 % | −19,2 Md $US | 24 |
| 38 |  Tunisie |
−5,3 % | −3,03 Md $US | 26 |
| 39 |  Royaume-Uni |
−5,3 % | −211 Md $US | 24 |
| 40 |  Belgique |
−5,2 % | −37,5 Md $US | 23 |
| 41 |  Israël |
−5,2 % | −31,6 Md $US | 25 |
| 42 |  Mozambique |
−5,1 % | −1,14 Md $US | 25 |
| 43 |  France |
−5,1 % | −170 Md $US | 26 |
| 44 |  Grenade |
−5,0 % | −71,7 M $US | 17 |
| 45 |  Birmanie |
−4,9 % | −4,04 Md $US | 26 |
| 46 |  Mexique |
−4,9 % | −89,1 Md $US | 26 |
| 47 |  Gambie |
−4,7 % | −122 M $US | 24 |
| 48 |  Hongrie |
−4,7 % | −11,5 Md $US | 26 |
| 49 |  Venezuela |
−4,5 % | −4,52 Md $US | 22 |
| 50 |  Philippines |
−4,5 % | −21,7 Md $US | 22 |
| 51 |  Slovaquie |
−4,5 % | −6,88 Md $US | 26 |
| 52 |  Rwanda |
−4,4 % | −712 M $US | 22 |
| 53 |  Monténégro |
−4,3 % | −395 M $US | 21 sur 24 |
| 54 |  Autriche |
−4,2 % | −24,2 Md $US | 24 |
| 55 |  Sierra Leone |
−4,2 % | −311 M $US | 25 |
| 56 |  Angola |
−4,1 % | −4,96 Md $US | 13 |
| 57 |  Lettonie |
−4,0 % | −1,97 Md $US | 24 |
| 58 |  Macédoine du Nord |
−4,0 % | −766 M $US | 22 |
| 59 |  Nouvelle-Zélande |
−4,0 % | −10,4 Md $US | 13 |
| 60 |  Yémen |
−3,9 % | n.d. | 8 sur 8 |
| 61 |  Îles Salomon |
−3,9 % | −68,3 M $US | 12 |
| 62 |  Russie |
−3,9 % | −99,1 Md $US | 12 |
| 63 |  Moldavie |
−3,9 % | −784 M $US | 22 |
| 64 |  Finlande |
−3,8 % | −12,2 Md $US | 17 |
| 65 |  Zambie |
−3,8 % | −1,11 Md $US | 24 |
| 66 |  Maurice |
−3,8 % | −614 M $US | 26 |
| 67 |  RCA |
−3,8 % | −116 M $US | 22 |
| 68 |  Arménie |
−3,7 % | −1,09 Md $US | 21 sur 21 |
| 69 |  Panama |
−3,7 % | −3,32 Md $US | 22 |
| 70 |  Maldives |
−3,6 % | −282 M $US | 26 |
| 71 |  Rép. dominicaine |
−3,6 % | −4,53 Md $US | 25 |
| 72 |  Malaisie |
−3,5 % | −16,7 Md $US | 26 |
| 73 |  Maroc |
−3,5 % | −6,41 Md $US | 25 |
| 74 |  Sao Tomé |
−3,4 % | −33,6 M $US | 18 |
| 75 |  Uruguay |
−3,4 % | −2,91 Md $US | 26 |
| 76 |  Costa Rica |
−3,4 % | −3,45 Md $US | 24 |
| 77 |  Togo |
−3,2 % | −383 M $US | 23 |
| 78 |  Burundi |
−3,2 % | −108 M $US | 26 |
| 79 |  Bangladesh |
−3,1 % | −14,3 Md $US | 26 |
| 80 |  Soudan |
−3,1 % | −1,86 Md $US | 22 |
| 81 |  Kazakhstan |
−3,1 % | −9,43 Md $US | 10 sur 24 |
| 82 |  Italie |
−3,1 % | −78,4 Md $US | 26 |
| 83 |  Bulgarie |
−3,0 % | −3,94 Md $US | 17 |
| 84 |  Croatie |
−3,0 % | −3,16 Md $US | 22 |
| 85 |  Côte d’Ivoire |
−3,0 % | −2,97 Md $US | 25 |
| 86 |  Indonésie |
−2,9 % | −42,2 Md $US | 23 |
| 87 |  Allemagne |
−2,9 % | −147 Md $US | 18 |
| 88 |  Niger |
−2,9 % | −630 M $US | 24 |
| 89 |  Australie |
−2,9 % | −51,9 Md $US | 19 |
| 90 |  Salvador |
−2,9 % | −1,05 Md $US | 26 |
| 91 |  Équateur |
−2,8 % | −3,64 Md $US | 17 |
| 92 |  Chili |
−2,8 % | −9,89 Md $US | 18 |
| 93 |  Turquie |
−2,8 % | −44,1 Md $US | 26 |
| 94 |  Bénin |
−2,7 % | −662 M $US | 25 |
| 95 |  Bhoutan |
−2,7 % | −95,7 M $US | 22 |
| 96 |  Islande |
−2,6 % | −1,02 Md $US | 17 |
| 97 |  Tanzanie |
−2,6 % | −2,37 Md $US | 26 |
| 98 |  Jamaïque |
−2,5 % | −575 M $US | 18 |
| 99 |  Slovénie |
−2,5 % | −2,00 Md $US | 23 |
| 100 |  Bosnie-Herzégovine |
−2,5 % | −807 M $US | 18 |
| 101 |  RDC |
−2,4 % | −2,21 Md $US | 18 |
| 102 |  Fidji |
−2,4 % | −150 M $US | 24 |
| 103 |  Espagne |
−2,4 % | −45,5 Md $US | 23 |
| 104 |  Pérou |
−2,4 % | −7,88 Md $US | 20 |
| 105 |  Corée du Sud |
−2,3 % | −43,5 Md $US | 5 sur 14 |
| 106 |  Sri Lanka |
−2,3 % | −2,48 Md $US | 26 |
| 107 |  Serbie |
−2,2 % | −2,21 Md $US | 21 |
| 108 |  Malte |
−2,2 % | −614 M $US | 22 |
| 109 |  Tchéquie |
−2,1 % | −8,38 Md $US | 22 |
| 110 |  Papouasie |
−2,1 % | −686 M $US | 17 |
| 111 |  Liberia |
−2,1 % | −110 M $US | 21 |
| 112 |  Madagascar |
−2,1 % | −411 M $US | 26 |
| 113 |  Cameroun |
−2,1 % | −1,22 Md $US | 17 |
| 114 |  Estonie |
−2,0 % | −927 M $US | 17 |
| 115 |  Luxembourg |
−2,0 % | −1,98 Md $US | 7 |
| 116 |  Guatemala |
−1,9 % | −2,32 Md $US | 26 |
| 117 |  Sainte-Lucie |
−1,9 % | −49,7 M $US | 25 |
| 118 |  Népal |
−1,8 % | −831 M $US | 20 |
| 119 |  Lituanie |
−1,8 % | −1,74 Md $US | 22 |
| 120 |  Albanie |
−1,8 % | −543 M $US | 26 |
| 121 |  Nigeria |
−1,8 % | −5,11 Md $US | 19 |
| 122 |  Thaïlande |
−1,7 % | −9,95 Md $US | 14 |
| 123 |  Canada |
−1,7 % | −38,7 Md $US | 16 |
| 124 |  Paraguay |
−1,7 % | −816 M $US | 17 |
| 125 |  Ouzbékistan |
−1,6 % | −2,42 Md $US | 14 |
| 126 |  Pays-Bas |
−1,6 % | −21,5 Md $US | 19 |
| 127 |  Mali |
−1,5 % | −459 M $US | 25 |
| 128 |  Burkina Faso |
−1,5 % | −419 M $US | 25 |
| 129 |  Géorgie |
−1,5 % | −556 M $US | 22 |
| 130 |  Djibouti |
−1,4 % | −64,9 M $US | 24 |
| 131 |  Ghana |
−1,3 % | −1,54 Md $US | 26 |
| 132 |  Comores |
−1,3 % | −24,0 M $US | 20 |
| 133 |  Suède |
−1,3 % | −8,63 Md $US | 14 |
| 134 |  Éthiopie |
−1,2 % | −1,50 Md $US | 26 |
| 135 |  Belize |
−1,0 % | −34,5 M $US | 25 |
| 136 |  Cambodge |
−1,0 % | −504 M $US | 22 |
| 137 |  Seychelles |
−1,0 % | −23,4 M $US | 13 |
| 138 |  Qatar |
−1,0 % | −2,06 Md $US | 4 |
| 139 |  Honduras |
−0,7 % | −295 M $US | 22 |
| 140 |  Japon |
−0,7 % | −31,5 Md $US | 26 |
| 141 |  Guinée équatoriale |
−0,6 % | −78,9 M $US | 12 |
| 142 |  Afghanistan |
−0,5 % | n.d. | 19 sur 24 |
| 143 |  Bahamas |
−0,5 % | n.d. | 24 |
| 144 |  Dominique |
−0,5 % | −3,38 M $US | 19 |
| 145 |  Palaos |
−0,4 % | −1,43 M $US | 15 |
| 146 |  Mauritanie |
−0,3 % | −34,1 M $US | 13 sur 22 |
| 147 |  Haïti |
−0,3 % | −91,9 M $US | 23 |
| 148 |  Tchad |
−0,3 % | −55,6 M $US | 18 |
| 149 |  Barbade |
−0,2 % | −19,5 M $US | 23 |
| 150 |  Argentine |
−0,2 % | −1,07 Md $US | 19 |
| 151 |  Vietnam |
+0,0 % | −227 M $US | 24 |
| 152 |  Turkménistan |
+0,1 % | +31,4 M $US | 8 |
| 153 |  Biélorussie |
+0,1 % | +59,1 M $US | 18 sur 25 |
| 154 |  Zimbabwe |
+0,1 % | +63,9 M $US | 19 sur 21 |
| 155 |  Suisse |
+0,2 % | +2,43 Md $US | 8 |
| 156 |  Taïwan |
+0,3 % | +2,47 Md $US | 7 sur 13 |
| 157 |  Tadjikistan |
+0,5 % | +86,5 M $US | 18 |
| 158 |  Oman |
+0,6 % | +625 M $US | 9 |
| 159 |  Saint-Marin |
+0,6 % | n.d. | 13 sur 22 |
| 160 |  Portugal |
+0,7 % | +2,33 Md $US | 22 |
| 161 |  Congo-Brazza |
+0,7 % | +119 M $US | 8 |
| 162 |  Cap-Vert |
+1,1 % | +32,5 M $US | 25 |
| 163 |  Tonga |
+1,2 % | +7,98 M $US | 7 |
| 164 |  Grèce |
+1,7 % | +4,85 Md $US | 21 |
| 165 |  Irlande |
+1,9 % | +13,8 Md $US | 13 |
| 166 |  Laos |
+1,9 % | +352 M $US | 23 |
| 167 |  Mongolie |
+2,2 % | +569 M $US | 16 |
| 168 |  Azerbaïdjan |
+2,6 % | +1,94 Md $US | 4 |
| 169 |  Kirghizistan |
+2,6 % | +592 M $US | 20 |
| 170 |  Érythrée |
+2,7 % (2019) | n.d. | 17 sur 20 |
| 171 |  Danemark |
+2,9 % | +13,5 Md $US | 6 |
| 172 |  Antigua-et-Barbuda |
+3,2 % | +74,0 M $US | 24 |
| 173 |  Liban |
+3,3 % | n.d. | 24 |
| 174 |  Soudan du Sud |
+3,3 % | n.d. | 8 sur 15 |
| 175 |  Chypre |
+3,4 % | +1,40 Md $US | 17 |
| 176 |  Nicaragua |
+3,5 % | +780 M $US | 10 |
| 177 |  Nauru |
+3,5 % | +6,19 M $US | 0 sur 17 |
| 178 |  EAU |
+3,9 % | n.d. | 6 |
| 179 |  Singapour |
+4,2 % | +25,2 Md $US | 2 |
| 180 |  Samoa |
+4,7 % | +60,3 M $US | 16 |
| 181 |  Îles Marshall |
+4,8 % | +14,8 M $US | 5 |
| 182 |  Lesotho |
+4,9 % | +126 M $US | 14 |
| 183 |  Vanuatu |
+6,2 % | +83,7 M $US | 16 |
| 184 |  Norvège |
+10,6 % | +56,3 Md $US | 1 |
| 185 |  Koweït |
+24,5 % | +38,5 Md $US | 0 |
| 186 |  Tuvalu |
+25,8 % | +14,8 M $US | 12 sur 22 |
| Non classé : dernières données antérieures à 2015 | ||||
 Syrie |
−7,8 % (2010) | −4,78 Md $US | 10 sur 11 | |
Le classement range 186 pays selon leur dernier solde budgétaire connu : 151 avaient un déficit et 35, un excédent. Les administrations publiques du monde avaient ensemble un déficit de 5,1 % du PIB en 2025. La moitié des pays avaient un déficit supérieur à 2,7 % du PIB.
Le solde budgétaire est ce qu'une administration perçoit en un an moins ce qu'elle dépense. Un solde négatif est un déficit, que l'État couvre en empruntant ; un solde positif est un excédent. Les chiffres portent sur les administrations publiques : l'État central avec les gouvernements des États, des régions et des collectivités locales et les caisses de sécurité sociale. Les pages présentent le solde en pourcentage du PIB du pays et en dollars américains.
Déficit (−) ou excédent (+) budgétaire par pays, % du PIB, 1999–2025
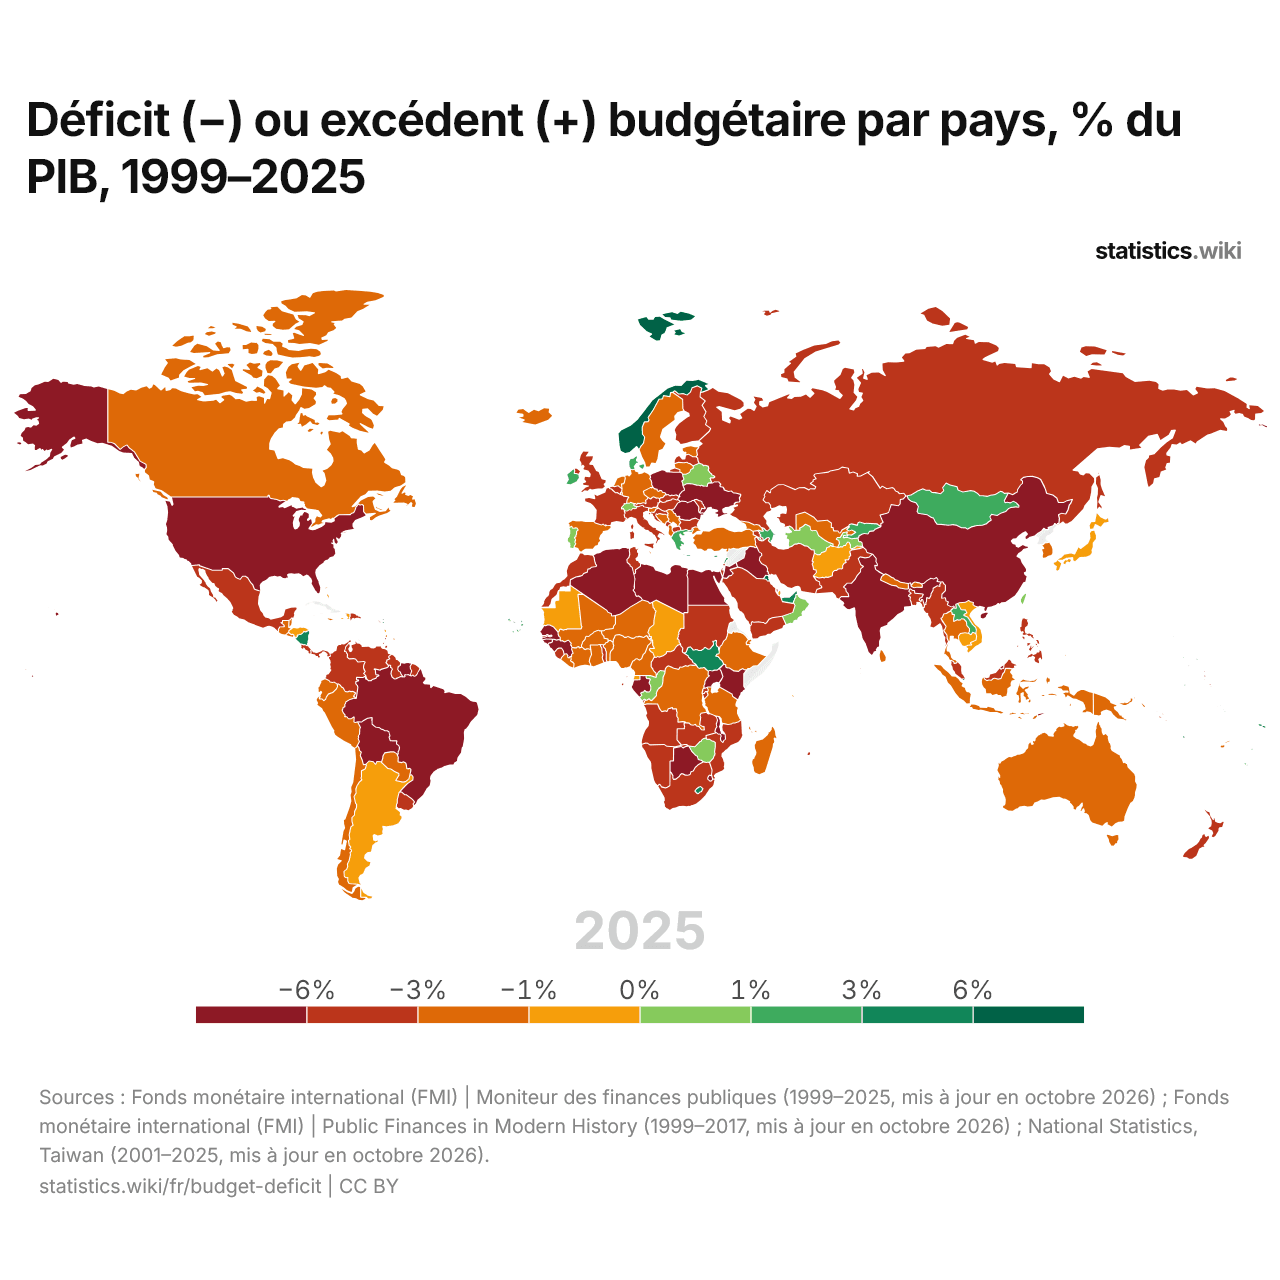
En 2025, 84 pays avaient un déficit budgétaire de plus de 3 % du PIB et 15 un excédent de plus de 3 % ; en 1999, c'était le cas de 63 et de 11.
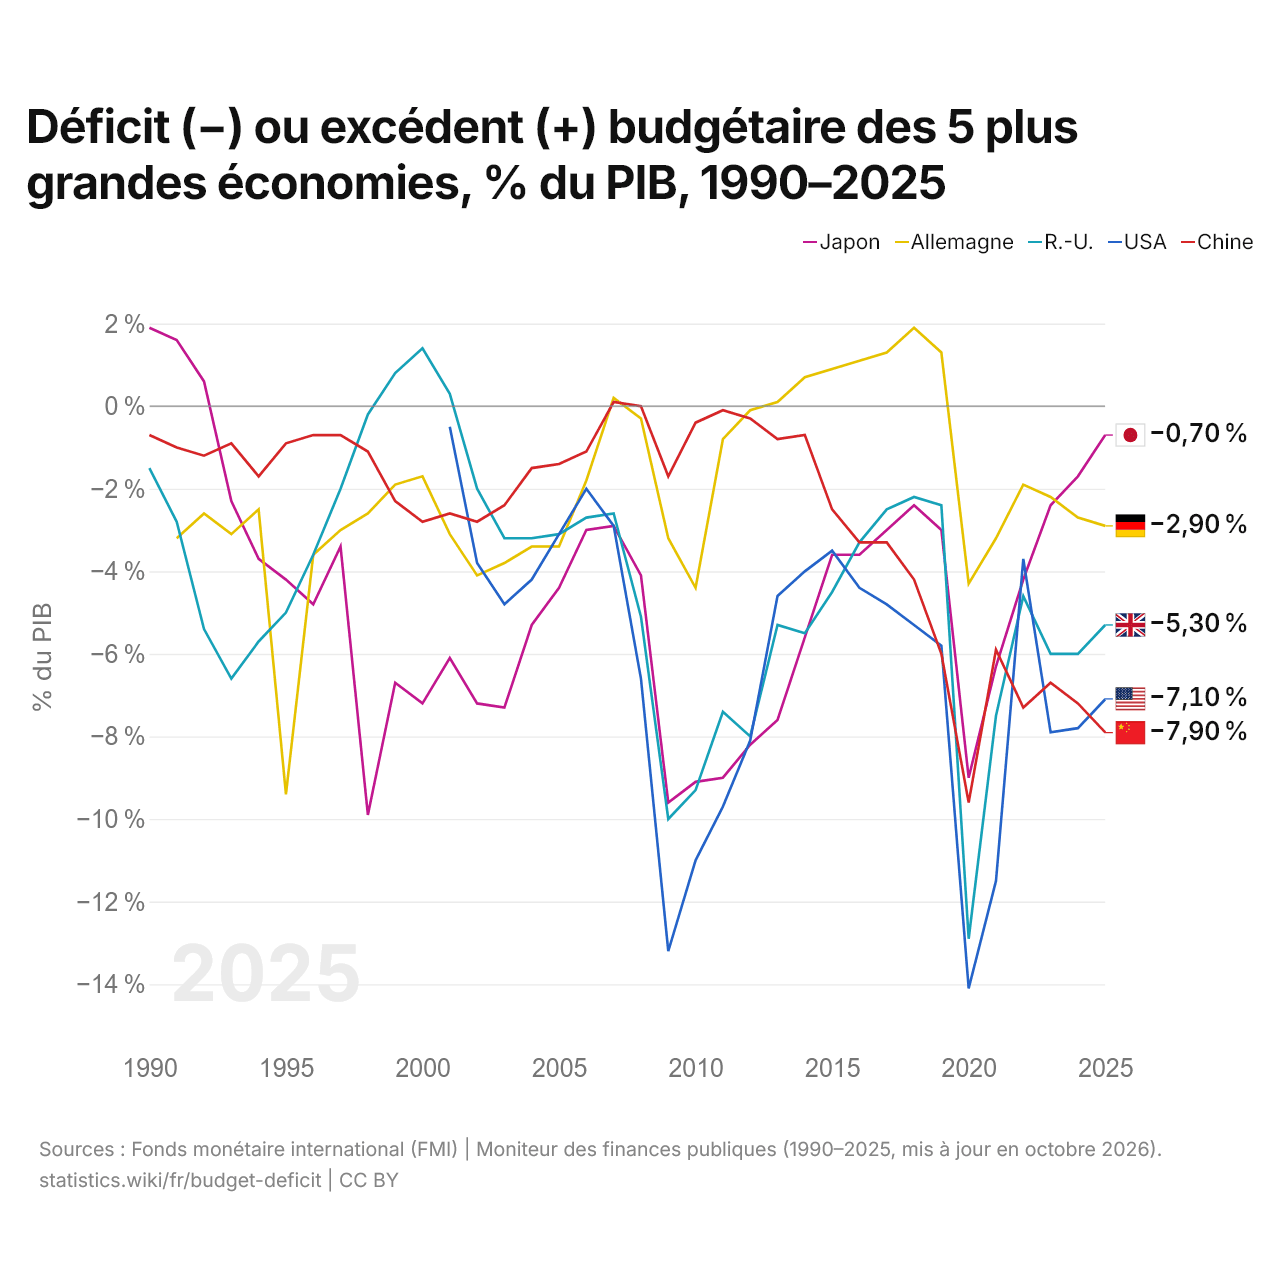
Déficit (−) ou excédent (+) budgétaire des 5 plus grandes économies, % du PIB, 1990–2025
| Année | % du PIB | ||||
|---|---|---|---|---|---|
| Japon | Allemagne | Royaume-Uni | États-Unis | Chine | |
| 2025 | −0,7 % | −2,9 % | −5,3 % | −7,1 % | −7,9 % |
| 2024 | −1,7 % | −2,7 % | −6 % | −7,8 % | −7,2 % |
| 2023 | −2,4 % | −2,2 % | −6 % | −7,9 % | −6,7 % |
| 2022 | −4,2 % | −1,9 % | −4,6 % | −3,7 % | −7,3 % |
| 2021 | −6,3 % | −3,2 % | −7,5 % | −11,5 % | −5,9 % |
| 2020 | −9 % | −4,3 % | −12,9 % | −14,1 % | −9,6 % |
| 2019 | −3 % | 1,3 % | −2,4 % | −5,8 % | −6 % |
| 2018 | −2,4 % | 1,9 % | −2,2 % | −5,3 % | −4,2 % |
| 2017 | −3 % | 1,3 % | −2,5 % | −4,8 % | −3,3 % |
| 2016 | −3,6 % | 1,1 % | −3,3 % | −4,4 % | −3,3 % |
| 2015 | −3,6 % | 0,9 % | −4,5 % | −3,5 % | −2,5 % |
| 2014 | −5,6 % | 0,7 % | −5,5 % | −4 % | −0,7 % |
| 2013 | −7,6 % | 0,1 % | −5,3 % | −4,6 % | −0,8 % |
| 2012 | −8,2 % | −0,1 % | −8 % | −8,1 % | −0,3 % |
| 2011 | −9 % | −0,8 % | −7,4 % | −9,7 % | −0,1 % |
| 2010 | −9,1 % | −4,4 % | −9,3 % | −11 % | −0,4 % |
| 2009 | −9,6 % | −3,2 % | −10 % | −13,2 % | −1,7 % |
| 2008 | −4,1 % | −0,3 % | −5,1 % | −6,6 % | 0 % |
| 2007 | −2,9 % | 0,2 % | −2,6 % | −2,9 % | 0,1 % |
| 2006 | −3 % | −1,8 % | −2,7 % | −2 % | −1,1 % |
| 2005 | −4,4 % | −3,4 % | −3,1 % | −3,1 % | −1,4 % |
| 2004 | −5,3 % | −3,4 % | −3,2 % | −4,2 % | −1,5 % |
| 2003 | −7,3 % | −3,8 % | −3,2 % | −4,8 % | −2,4 % |
| 2002 | −7,2 % | −4,1 % | −2 % | −3,8 % | −2,8 % |
| 2001 | −6,1 % | −3,1 % | 0,3 % | −0,5 % | −2,6 % |
| 2000 | −7,2 % | −1,7 % | 1,4 % | - | −2,8 % |
| 1999 | −6,7 % | −1,9 % | 0,8 % | - | −2,3 % |
| 1998 | −9,9 % | −2,6 % | −0,2 % | - | −1,1 % |
| 1997 | −3,4 % | −3 % | −2 % | - | −0,7 % |
| 1996 | −4,8 % | −3,6 % | −3,6 % | - | −0,7 % |
| 1995 | −4,2 % | −9,4 % | −5 % | - | −0,9 % |
| 1994 | −3,7 % | −2,5 % | −5,7 % | - | −1,7 % |
| 1993 | −2,3 % | −3,1 % | −6,6 % | - | −0,9 % |
| 1992 | 0,6 % | −2,6 % | −5,4 % | - | −1,2 % |
| 1991 | 1,6 % | −3,2 % | −2,8 % | - | −1 % |
| 1990 | 1,9 % | - | −1,5 % | - | −0,7 % |
En 2025, le solde budgétaire était de −0,7 % du PIB au Japon, −2,9 % en Allemagne, −5,3 % au Royaume-Uni, −7,1 % aux États-Unis et −7,9 % en Chine.
Pays en excédent budgétaire en 2025
-
Tuvalu
-
Koweït
-
Norvège
-
Vanuatu
-
Lesotho
-
Îles Marshall
-
Samoa
-
Singapour
-
EAU
-
Nauru
-
Nicaragua
-
Chypre
-
Soudan du Sud
-
Liban
-
Antigua
-
Danemark
-
Kirghizistan
-
Azerbaïdjan
-
Mongolie
-
Laos
-
Irlande
-
Grèce
-
Tonga
-
Cap-Vert
-
Congo-Brazza
-
Portugal
-
Saint-Marin
-
Oman
-
Tadjikistan
-
Taïwan
-
Suisse
-
Zimbabwe
-
Biélorussie
-
Turkménistan
Les 10 plus grands déficits budgétaires en 2025
En 2025, le plus grand excédent budgétaire était celui de Tuvalu, 25,8 % du PIB, et le plus grand déficit celui du Timor oriental, 46,2 %.
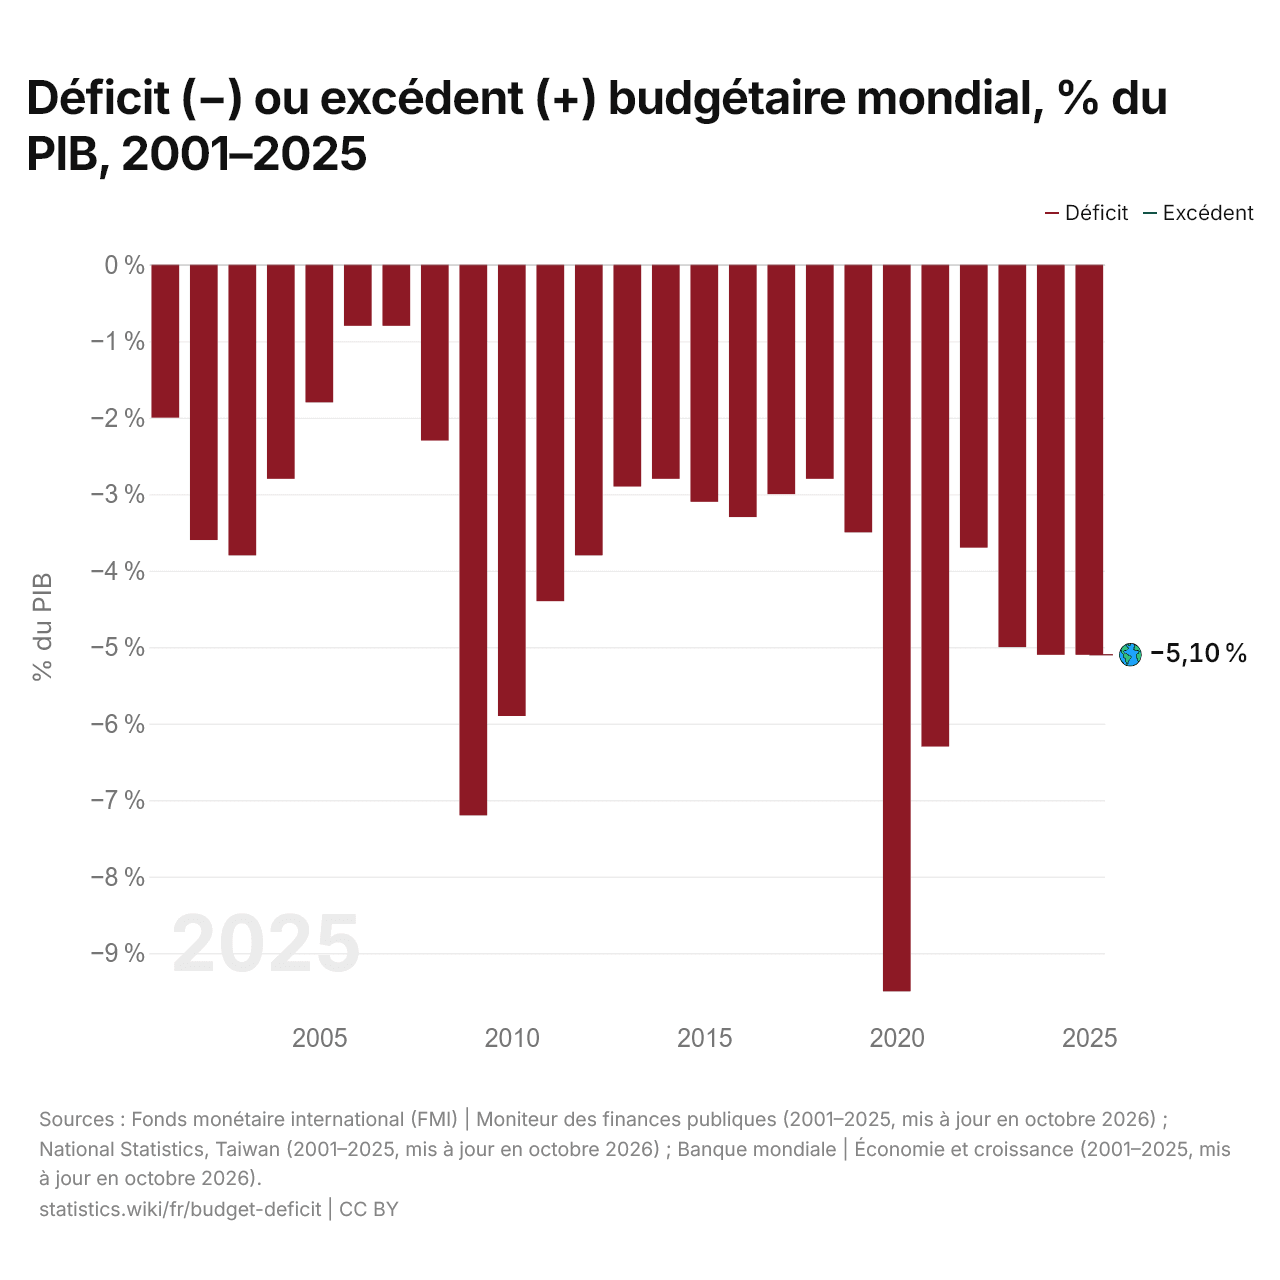
Déficit (−) ou excédent (+) budgétaire mondial, % du PIB, 2001–2025
| Année | % du PIB |
|---|---|
| Monde | |
| 2025 | −5,1 % |
| 2024 | −5,1 % |
| 2023 | −5 % |
| 2022 | −3,7 % |
| 2021 | −6,3 % |
| 2020 | −9,5 % |
| 2019 | −3,5 % |
| 2018 | −2,8 % |
| 2017 | −3 % |
| 2016 | −3,3 % |
| 2015 | −3,1 % |
| 2014 | −2,8 % |
| 2013 | −2,9 % |
| 2012 | −3,8 % |
| 2011 | −4,4 % |
| 2010 | −5,9 % |
| 2009 | −7,2 % |
| 2008 | −2,3 % |
| 2007 | −0,8 % |
| 2006 | −0,8 % |
| 2005 | −1,8 % |
| 2004 | −2,8 % |
| 2003 | −3,8 % |
| 2002 | −3,6 % |
| 2001 | −2 % |
En 2025, les administrations publiques du monde avaient ensemble un déficit budgétaire de 5,1 % du PIB, contre un déficit de 2,0 % en 2001. Le plus grand déficit a été de 9,5 %, en 2020. Leur budget est déficitaire chaque année depuis 2001.
Comparer le déficit budgétaire de 2 pays au choix
Sources :
- Fonds monétaire international (FMI) | Moniteur des finances publiques (1990–2025, mis à jour en octobre 2026)
- Fonds monétaire international (FMI) | Public Finances in Modern History (1999–2017, mis à jour en octobre 2026)
- National Statistics, Taiwan (2001–2025, mis à jour en octobre 2026)
- Banque mondiale | Économie et croissance (2001–2025, mis à jour en octobre 2026)
Creative Commons Attribution (CC BY) : vous pouvez copier, partager, adapter et réutiliser ce contenu, y compris à des fins commerciales, à condition de citer statistics.wiki et d’indiquer les modifications apportées. Les sources citées ci-dessus peuvent avoir leurs propres conditions de licence.