
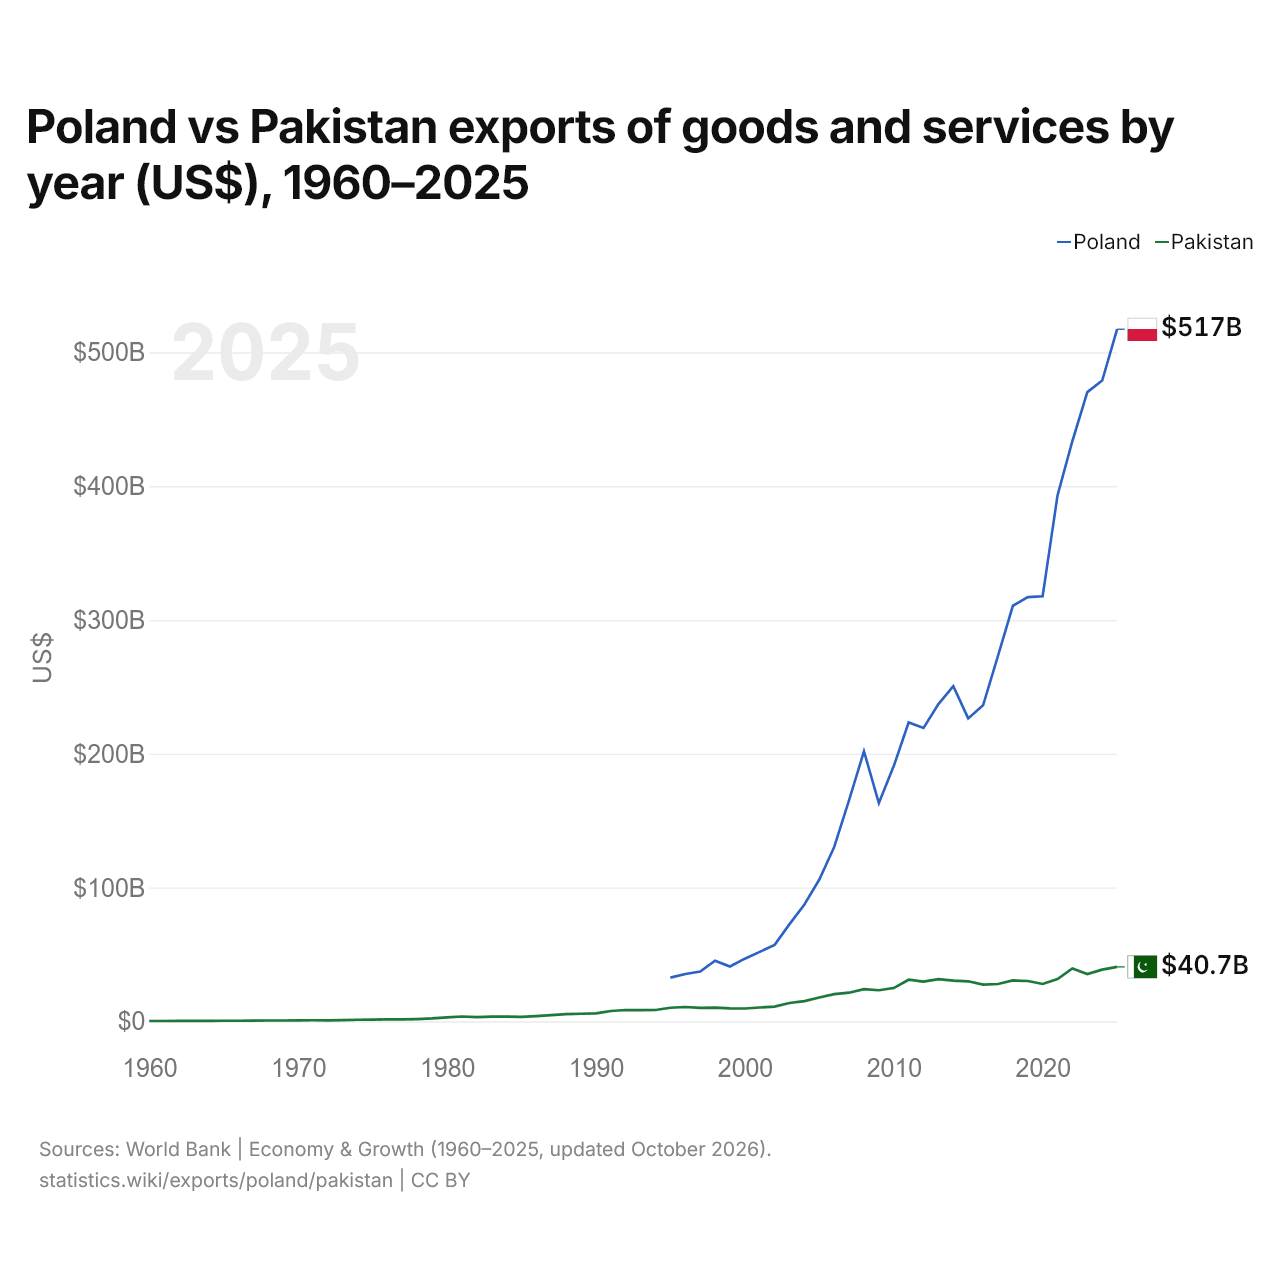
Poland vs Pakistan exports of goods and services by year (US$), 1960–2025
| Year | US$ | |
|---|---|---|
 Poland |
 Pakistan |
|
| 2025 | $517,233,997,757 | $40,670,467,312 |
| 2024 | $478,889,163,360 | $38,607,805,446 |
| 2023 | $470,257,077,151 | $35,331,726,544 |
| 2022 | $433,728,761,283 | $39,515,650,036 |
| 2021 | $393,088,751,264 | $31,546,332,473 |
| 2020 | $317,704,377,851 | $27,935,253,909 |
| 2019 | $317,089,370,015 | $30,136,170,670 |
| 2018 | $310,583,581,161 | $30,562,205,606 |
| 2017 | $273,120,944,886 | $27,888,160,733 |
| 2016 | $236,186,977,574 | $27,400,963,629 |
| 2015 | $226,401,379,493 | $29,920,081,166 |
| 2014 | $250,578,055,388 | $30,382,086,972 |
| 2013 | $237,156,858,930 | $31,497,982,328 |
| 2012 | $219,299,490,073 | $29,697,611,485 |
| 2011 | $223,375,954,487 | $31,088,962,295 |
| 2010 | $190,729,280,669 | $24,858,636,643 |
| 2009 | $163,147,702,893 | $23,213,002,702 |
| 2008 | $201,758,478,393 | $24,013,343,672 |
| 2007 | $165,316,208,747 | $21,406,517,114 |
| 2006 | $130,258,272,379 | $20,313,153,771 |
| 2005 | $105,993,139,201 | $17,790,723,345 |
| 2004 | $87,290,664,313 | $15,103,000,000 |
| 2003 | $72,646,837,616 | $13,669,643,162 |
| 2002 | $57,159,341,603 | $11,029,069,178 |
| 2001 | $51,902,098,244 | $10,322,860,873 |
| 2000 | $46,824,088,402 | $9,580,014,110 |
| 1999 | $40,963,593,630 | $9,668,690,721 |
| 1998 | $45,328,595,270 | $10,252,214,044 |
| 1997 | $37,183,635,980 | $10,040,500,611 |
| 1996 | $35,353,288,083 | $10,703,072,794 |
| 1995 | $32,643,940,184 | $10,132,269,179 |
| 1994 | - | $8,449,778,027 |
| 1993 | - | $8,394,305,117 |
| 1992 | - | $8,442,738,387 |
| 1991 | - | $7,725,461,182 |
| 1990 | - | $5,917,028,935 |
| 1989 | - | $5,652,851,126 |
| 1988 | - | $5,331,871,262 |
| 1987 | - | $4,605,651,034 |
| 1986 | - | $3,922,380,657 |
| 1985 | - | $3,290,831,135 |
| 1984 | - | $3,549,643,811 |
| 1983 | - | $3,495,669,291 |
| 1982 | - | $3,131,090,047 |
| 1981 | - | $3,606,767,677 |
| 1980 | - | $2,978,282,828 |
| 1979 | - | $2,174,646,465 |
| 1978 | - | $1,679,696,970 |
| 1977 | - | $1,413,232,323 |
| 1976 | - | $1,402,121,212 |
| 1975 | - | $1,312,525,253 |
| 1974 | - | $1,208,080,808 |
| 1973 | - | $942,116,712 |
| 1972 | - | $675,563,975 |
| 1971 | - | $823,603,528 |
| 1970 | - | $763,754,725 |
| 1969 | - | $601,007,980 |
| 1968 | - | $605,837,883 |
| 1967 | - | $516,589,668 |
| 1966 | - | $453,170,937 |
| 1965 | - | $418,311,634 |
| 1964 | - | $401,931,961 |
| 1963 | - | $378,622,428 |
| 1962 | - | $288,744,225 |
| 1961 | - | $255,984,880 |
| 1960 | - | $269,004,620 |
In 2025, Poland exported $517 billion of goods and services and Pakistan $40.7 billion: Poland's exports were 13 times as large. In 1995, Poland's exports were 3.2 times as large: $32.6 billion for Poland and $10.1 billion for Pakistan.
Poland's exports of goods and services have been larger than Pakistan's every year since 1995.
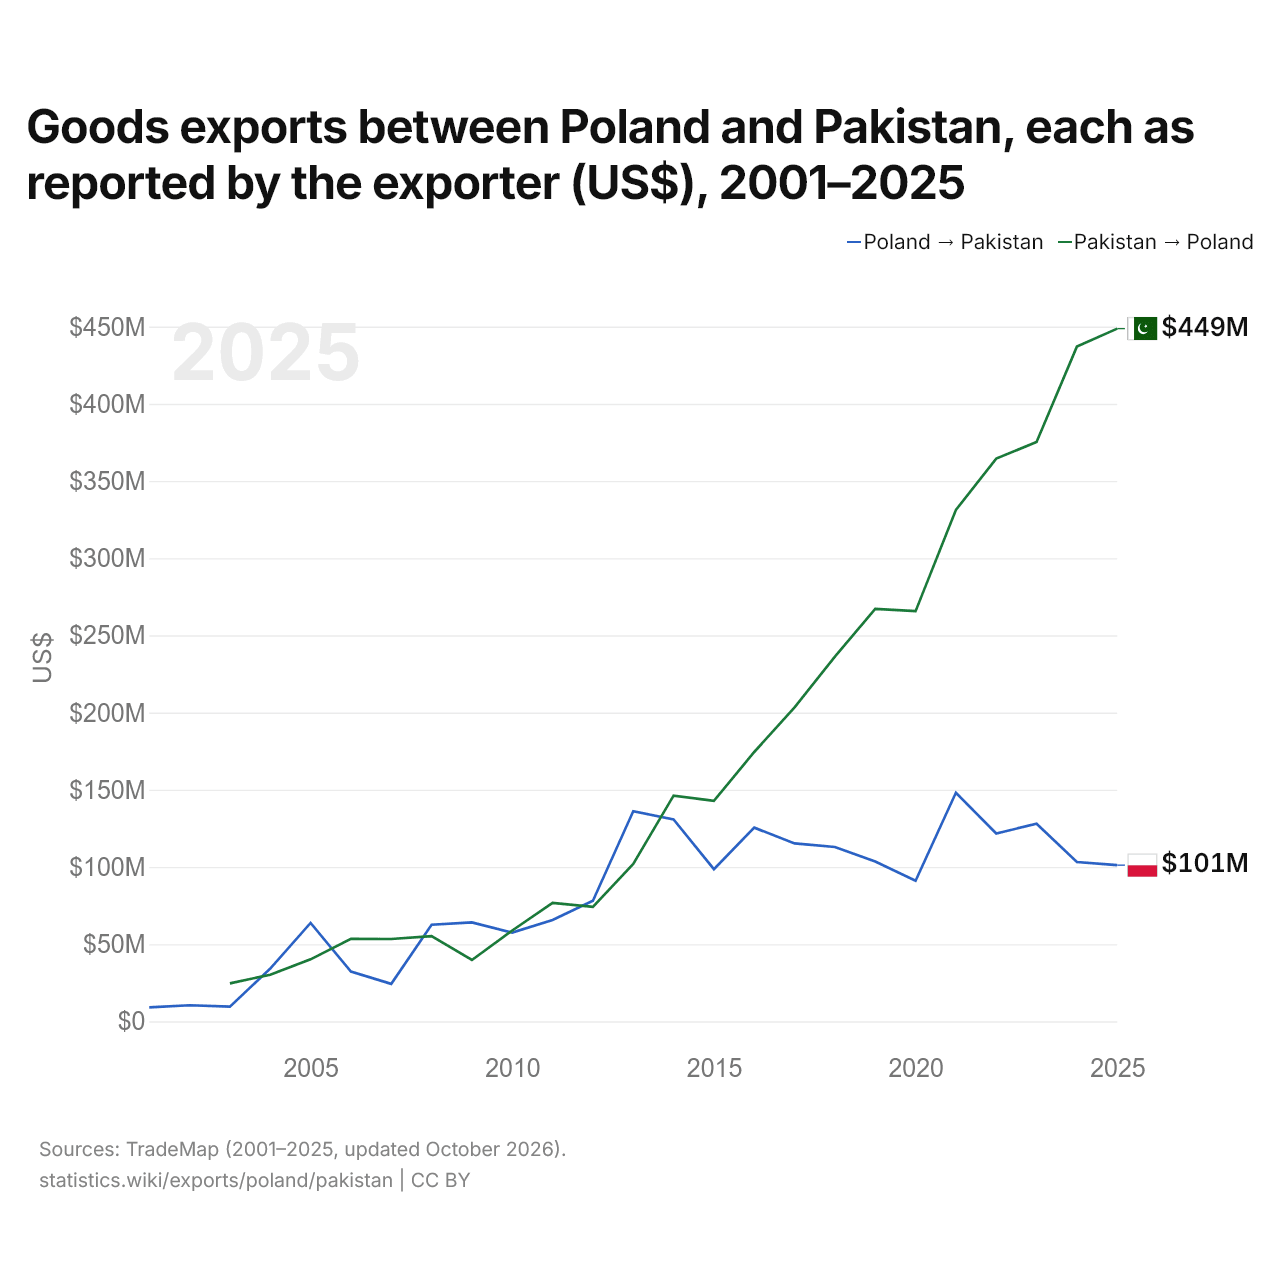
Goods exports between Poland and Pakistan, each as reported by the exporter (US$), 2001–2025
| Year | US$ | |
|---|---|---|
| Poland → Pakistan | Pakistan → Poland | |
| 2025 | $101,168,000 | $448,703,000 |
| 2024 | $103,160,000 | $437,036,000 |
| 2023 | $127,974,000 | $375,241,000 |
| 2022 | $121,666,000 | $364,483,000 |
| 2021 | $148,111,000 | $331,272,000 |
| 2020 | $91,026,000 | $265,654,000 |
| 2019 | $103,457,000 | $267,144,000 |
| 2018 | $112,950,000 | $236,298,000 |
| 2017 | $115,242,000 | $203,342,000 |
| 2016 | $125,458,000 | $174,464,000 |
| 2015 | $98,547,000 | $142,839,000 |
| 2014 | $130,794,000 | $146,173,000 |
| 2013 | $136,098,000 | $102,008,000 |
| 2012 | $78,097,000 | $74,158,000 |
| 2011 | $65,648,000 | $76,652,000 |
| 2010 | $57,445,000 | $58,845,000 |
| 2009 | $64,082,000 | $39,732,000 |
| 2008 | $62,536,000 | $55,138,000 |
| 2007 | $24,287,000 | $53,340,000 |
| 2006 | $32,202,000 | $53,385,000 |
| 2005 | $63,745,000 | $40,138,000 |
| 2004 | $34,157,000 | $30,207,000 |
| 2003 | $9,521,000 | $24,617,000 |
| 2002 | $10,428,000 | - |
| 2001 | $9,028,000 | - |
In 2025, Poland reported goods exports of $101 million to Pakistan, and Pakistan reported $449 million to Poland: 4.4 times as much from Pakistan. In 2003, they were $9.52 million from Poland and $24.6 million from Pakistan.
Poland vs Pakistan: exports figures
|
Poland
|
Pakistan
|
|
|---|---|---|
| Exports | $517B (2025) | $40.7B (2025) |
| World rank | 20/176 | 69/176 |
| Share of world | 1.48% | 0.12% |
| % of GDP | 50.0% | 10.0% |
| Largest goods category | Machinery, electronics & vehicles (39.5%, 2025) | Textiles, clothing, footwear, furniture & toys (63.7%, 2025) |
| Largest goods destination | Germany (27%, 2025) | United States (19.3%, 2025) |
Compare the exports of any 2 countries
Sources:
- World Bank | Economy & Growth (1960–2025, updated October 2026)
- TradeMap (2001–2025, updated October 2026)
Creative Commons Attribution (CC BY): you may copy, share, adapt and reuse this content, also commercially, as long as you credit statistics.wiki and note any changes you made. The sources listed above may have their own license terms.