
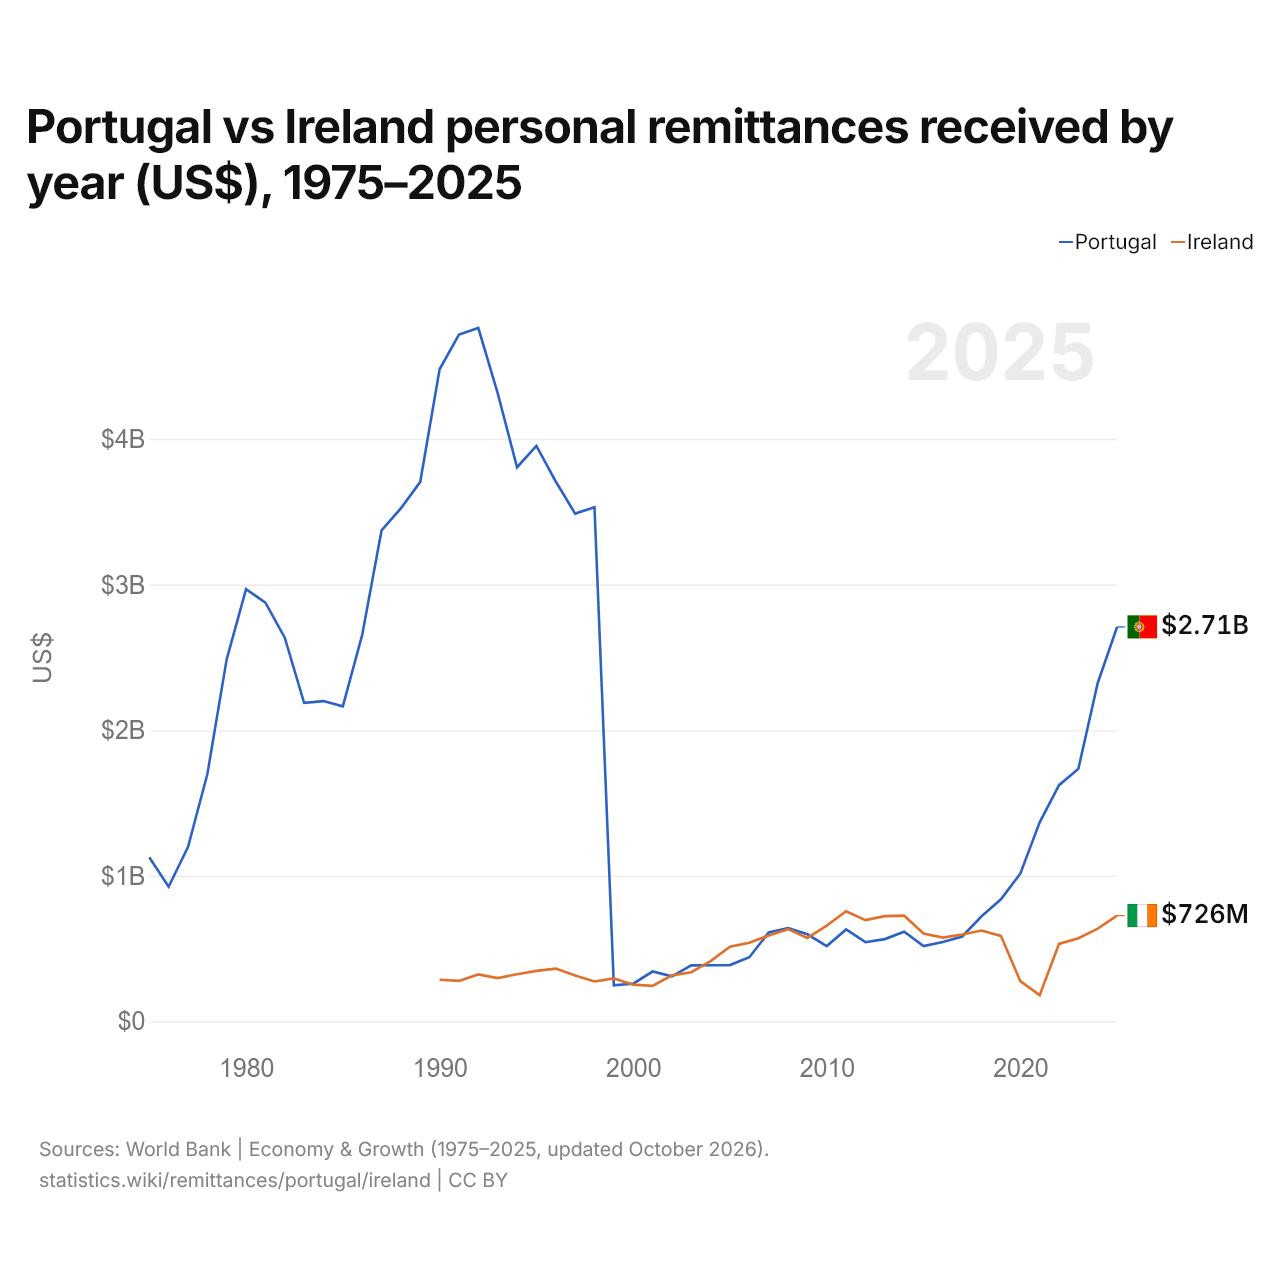
Portugal vs Irlanda: remesas personales recibidas por año (US$), 1975–2025
| Año | US$ | |
|---|---|---|
 Portugal |
 Irlanda |
|
| 2025 | 2.709.116.527 US$ | 726.051.325 US$ |
| 2024 | 2.324.256.449 US$ | 637.050.532 US$ |
| 2023 | 1.735.480.385 US$ | 570.929.941 US$ |
| 2022 | 1.622.496.814 US$ | 531.789.593 US$ |
| 2021 | 1.367.098.973 US$ | 179.854.620 US$ |
| 2020 | 1.014.602.356 US$ | 276.051.018 US$ |
| 2019 | 838.080.798 US$ | 586.686.133 US$ |
| 2018 | 721.713.702 US$ | 623.629.069 US$ |
| 2017 | 583.072.771 US$ | 596.677.078 US$ |
| 2016 | 545.320.433 US$ | 575.484.814 US$ |
| 2015 | 516.849.372 US$ | 603.613.505 US$ |
| 2014 | 615.196.567 US$ | 725.770.039 US$ |
| 2013 | 564.734.515 US$ | 722.434.618 US$ |
| 2012 | 543.340.059 US$ | 694.996.339 US$ |
| 2011 | 631.366.042 US$ | 756.001.123 US$ |
| 2010 | 516.896.598 US$ | 658.009.929 US$ |
| 2009 | 598.188.764 US$ | 573.235.694 US$ |
| 2008 | 640.917.116 US$ | 633.377.747 US$ |
| 2007 | 609.952.879 US$ | 589.415.067 US$ |
| 2006 | 440.128.946 US$ | 539.348.054 US$ |
| 2005 | 386.598.230 US$ | 512.338.250 US$ |
| 2004 | 385.229.332 US$ | 413.908.020 US$ |
| 2003 | 384.011.510 US$ | 337.132.690 US$ |
| 2002 | 309.037.743 US$ | 316.105.774 US$ |
| 2001 | 342.123.730 US$ | 243.999.329 US$ |
| 2000 | 258.747.232 US$ | 251.908.646 US$ |
| 1999 | 248.140.558 US$ | 295.185.028 US$ |
| 1998 | 3.531.591.603 US$ | 273.664.887 US$ |
| 1997 | 3.487.517.949 US$ | 314.160.645 US$ |
| 1996 | 3.708.172.450 US$ | 362.407.044 US$ |
| 1995 | 3.952.520.160 US$ | 346.958.832 US$ |
| 1994 | 3.805.934.326 US$ | 323.624.603 US$ |
| 1993 | 4.315.121.582 US$ | 297.324.707 US$ |
| 1992 | 4.762.224.121 US$ | 322.315.094 US$ |
| 1991 | 4.717.690.918 US$ | 277.613.403 US$ |
| 1990 | 4.478.965.820 US$ | 285.673.554 US$ |
| 1989 | 3.705.802.979 US$ | - |
| 1988 | 3.524.135.010 US$ | - |
| 1987 | 3.371.763.184 US$ | - |
| 1986 | 2.654.412.598 US$ | - |
| 1985 | 2.163.800.537 US$ | - |
| 1984 | 2.199.776.855 US$ | - |
| 1983 | 2.187.293.945 US$ | - |
| 1982 | 2.635.154.053 US$ | - |
| 1981 | 2.876.444.824 US$ | - |
| 1980 | 2.968.488.037 US$ | - |
| 1979 | 2.486.267.578 US$ | - |
| 1978 | 1.697.034.912 US$ | - |
| 1977 | 1.197.053.955 US$ | - |
| 1976 | 924.339.478 US$ | - |
| 1975 | 1.127.104.004 US$ | - |
En 2025, las remesas personales recibidas fueron de 2,71 mil millones de US$ en Portugal y de 726 millones de US$ en Irlanda: 3,7 veces más en Portugal. En 1990, las remesas recibidas fueron 16 veces mayores en Portugal: 4,48 mil millones de US$ en Portugal y 286 millones de US$ en Irlanda.
Las remesas personales recibidas en Portugal han sido mayores que las recibidas en Irlanda todos los años desde 2018.
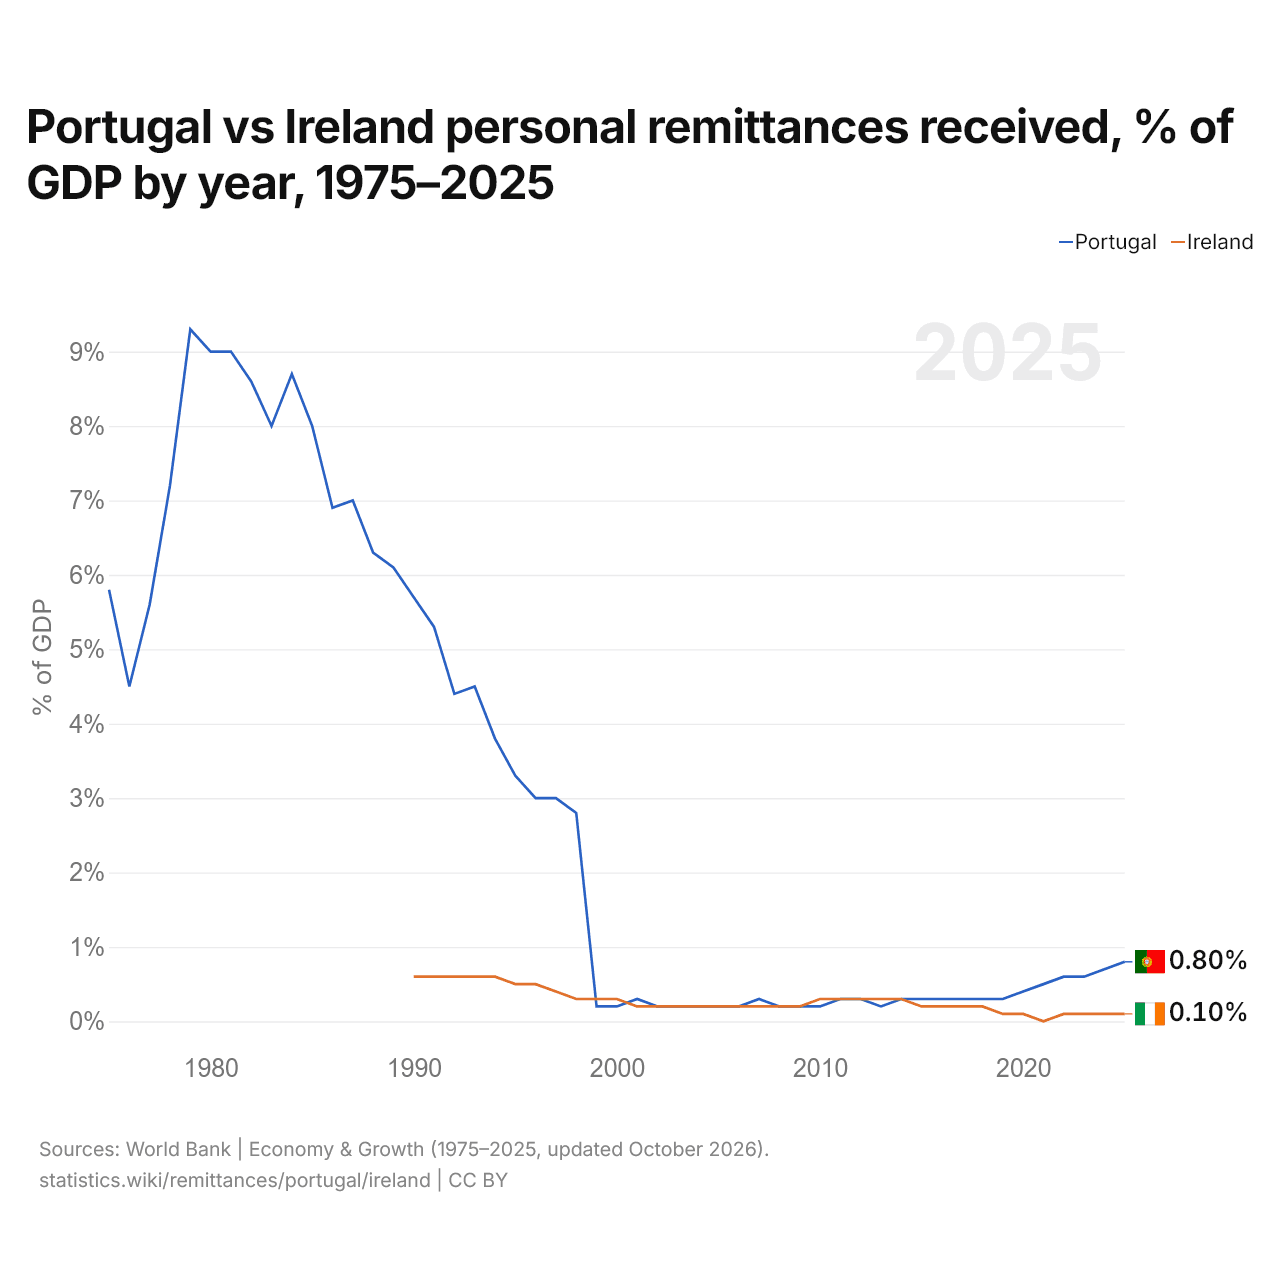
Portugal vs Irlanda: remesas personales recibidas, % del PIB por año, 1975–2025
| Año | % del PIB | |
|---|---|---|
|
Portugal
|
Irlanda
|
|
| 2025 | 0,8 % | 0,1 % |
| 2024 | 0,7 % | 0,1 % |
| 2023 | 0,6 % | 0,1 % |
| 2022 | 0,6 % | 0,1 % |
| 2021 | 0,5 % | 0 % |
| 2020 | 0,4 % | 0,1 % |
| 2019 | 0,3 % | 0,1 % |
| 2018 | 0,3 % | 0,2 % |
| 2017 | 0,3 % | 0,2 % |
| 2016 | 0,3 % | 0,2 % |
| 2015 | 0,3 % | 0,2 % |
| 2014 | 0,3 % | 0,3 % |
| 2013 | 0,2 % | 0,3 % |
| 2012 | 0,3 % | 0,3 % |
| 2011 | 0,3 % | 0,3 % |
| 2010 | 0,2 % | 0,3 % |
| 2009 | 0,2 % | 0,2 % |
| 2008 | 0,2 % | 0,2 % |
| 2007 | 0,3 % | 0,2 % |
| 2006 | 0,2 % | 0,2 % |
| 2005 | 0,2 % | 0,2 % |
| 2004 | 0,2 % | 0,2 % |
| 2003 | 0,2 % | 0,2 % |
| 2002 | 0,2 % | 0,2 % |
| 2001 | 0,3 % | 0,2 % |
| 2000 | 0,2 % | 0,3 % |
| 1999 | 0,2 % | 0,3 % |
| 1998 | 2,8 % | 0,3 % |
| 1997 | 3 % | 0,4 % |
| 1996 | 3 % | 0,5 % |
| 1995 | 3,3 % | 0,5 % |
| 1994 | 3,8 % | 0,6 % |
| 1993 | 4,5 % | 0,6 % |
| 1992 | 4,4 % | 0,6 % |
| 1991 | 5,3 % | 0,6 % |
| 1990 | 5,7 % | 0,6 % |
| 1989 | 6,1 % | - |
| 1988 | 6,3 % | - |
| 1987 | 7 % | - |
| 1986 | 6,9 % | - |
| 1985 | 8 % | - |
| 1984 | 8,7 % | - |
| 1983 | 8 % | - |
| 1982 | 8,6 % | - |
| 1981 | 9 % | - |
| 1980 | 9 % | - |
| 1979 | 9,3 % | - |
| 1978 | 7,2 % | - |
| 1977 | 5,6 % | - |
| 1976 | 4,5 % | - |
| 1975 | 5,8 % | - |
En 2025, las remesas recibidas equivalieron al 0,8 % del PIB en Portugal y al 0,1 % en Irlanda: 0,7 puntos porcentuales más en Portugal. En 2015, los porcentajes eran del 0,3 % en Portugal y del 0,2 % en Irlanda, 0,1 puntos porcentuales más en Portugal.
Portugal vs Irlanda: últimas remesas en US$ y % del PIB
|
Portugal
|
Irlanda
|
|
|---|---|---|
| Remesas recibidas | 2710 M US$ | 726 M US$ |
| % del PIB | 0,8 % | 0,1 % |
| Puesto mundial | 65/181 | 103/181 |
Comparar las remesas recibidas por 2 países cualesquiera
Fuentes:
- Banco Mundial | Economía y crecimiento (1975–2025, actualizado en octubre de 2026)
Creative Commons Atribución (CC BY): puedes copiar, compartir, adaptar y reutilizar este contenido, también con fines comerciales, siempre que cites a statistics.wiki e indiques los cambios que hayas hecho. Las fuentes indicadas arriba pueden tener sus propias condiciones de licencia.