
Corea del Sur vs India: gasto militar (US$), 1960–2025
| Año | US$ | |
|---|---|---|
 Corea del Sur |
 India |
|
| 2025 | 48.709.253.277 US$ | 90.798.828.764 US$ |
| 2024 | 47.604.584.212 US$ | 83.617.044.488 US$ |
| 2023 | 47.951.130.531 US$ | 82.509.152.616 US$ |
| 2022 | 46.359.252.052 US$ | 77.449.222.402 US$ |
| 2021 | 50.870.151.905 US$ | 78.191.725.253 US$ |
| 2020 | 46.095.377.472 US$ | 74.992.561.781 US$ |
| 2019 | 44.114.445.480 US$ | 72.194.485.141 US$ |
| 2018 | 43.079.874.663 US$ | 65.526.705.051 US$ |
| 2017 | 39.302.563.072 US$ | 67.122.372.185 US$ |
| 2016 | 36.885.795.328 US$ | 58.360.161.904 US$ |
| 2015 | 36.577.398.254 US$ | 51.694.633.429 US$ |
| 2014 | 37.556.608.791 US$ | 51.875.005.787 US$ |
| 2013 | 34.307.070.756 US$ | 47.324.579.926 US$ |
| 2012 | 31.942.213.081 US$ | 47.850.592.348 US$ |
| 2011 | 30.993.291.164 US$ | 49.304.112.652 US$ |
| 2010 | 28.165.435.409 US$ | 48.416.295.009 US$ |
| 2009 | 24.575.663.114 US$ | 41.992.838.663 US$ |
| 2008 | 26.072.488.666 US$ | 31.548.455.391 US$ |
| 2007 | 27.726.120.341 US$ | 30.153.728.550 US$ |
| 2006 | 25.177.251.311 US$ | 25.202.552.677 US$ |
| 2005 | 22.159.583.872 US$ | 23.877.987.286 US$ |
| 2004 | 17.829.876.370 US$ | 20.060.173.759 US$ |
| 2003 | 15.846.991.271 US$ | 16.272.868.820 US$ |
| 2002 | 14.101.722.615 US$ | 14.556.643.755 US$ |
| 2001 | 12.941.804.643 US$ | 14.196.383.987 US$ |
| 2000 | 13.801.137.368 US$ | 13.812.655.617 US$ |
| 1999 | 12.854.147.922 US$ | 13.568.236.197 US$ |
| 1998 | 11.102.240.298 US$ | 11.491.562.580 US$ |
| 1997 | 15.692.748.251 US$ | 11.011.060.330 US$ |
| 1996 | 17.316.757.593 US$ | 9.715.428.866 US$ |
| 1995 | 16.957.356.948 US$ | 9.289.809.855 US$ |
| 1994 | 15.299.089.524 US$ | 8.720.806.769 US$ |
| 1993 | 13.866.580.604 US$ | 7.886.030.639 US$ |
| 1992 | 13.540.396.227 US$ | 7.795.566.320 US$ |
| 1991 | 12.649.451.495 US$ | 7.859.996.106 US$ |
| 1990 | 11.689.298.860 US$ | 10.098.689.025 US$ |
| 1989 | 10.907.333.034 US$ | 10.462.658.221 US$ |
| 1988 | 8.796.936.789 US$ | 11.058.855.369 US$ |
| 1987 | 6.803.022.681 US$ | 11.806.796.950 US$ |
| 1986 | 5.936.223.154 US$ | 10.224.531.865 US$ |
| 1985 | 5.422.235.396 US$ | 8.298.407.791 US$ |
| 1984 | 5.241.380.405 US$ | 7.249.162.800 US$ |
| 1983 | 5.132.439.554 US$ | 7.253.000.983 US$ |
| 1982 | 4.987.804.032 US$ | 6.714.173.824 US$ |
| 1981 | 4.766.171.527 US$ | 6.165.115.094 US$ |
| 1980 | 4.258.252.969 US$ | 5.839.130.230 US$ |
| 1979 | 3.762.231.409 US$ | 4.989.684.211 US$ |
| 1978 | 3.365.705.625 US$ | 4.292.525.952 US$ |
| 1977 | 2.357.516.549 US$ | 3.842.345.403 US$ |
| 1976 | 1.794.370.357 US$ | 3.572.358.168 US$ |
| 1975 | 1.079.466.421 US$ | 3.480.654.866 US$ |
| 1974 | 901.973.336 US$ | 3.187.664.078 US$ |
| 1973 | 567.586.908 US$ | 2.701.198.653 US$ |
| 1972 | 550.631.060 US$ | 2.657.020.024 US$ |
| 1971 | 473.747.785 US$ | 2.459.978.741 US$ |
| 1970 | 400.044.112 US$ | 1.988.270.343 US$ |
| 1969 | 363.531.133 US$ | 1.835.743.136 US$ |
| 1968 | 291.743.858 US$ | 1.722.924.879 US$ |
| 1967 | 229.341.322 US$ | 1.616.312.294 US$ |
| 1966 | 185.541.758 US$ | 1.628.330.499 US$ |
| 1965 | 138.538.825 US$ | 2.305.663.940 US$ |
| 1964 | 143.745.769 US$ | 2.157.116.120 US$ |
| 1963 | 193.325.430 US$ | 1.949.130.603 US$ |
| 1962 | 194.130.359 US$ | 1.157.501.505 US$ |
| 1961 | 163.260.114 US$ | 813.821.845 US$ |
| 1960 | 284.374.356 US$ | 742.083.444 US$ |
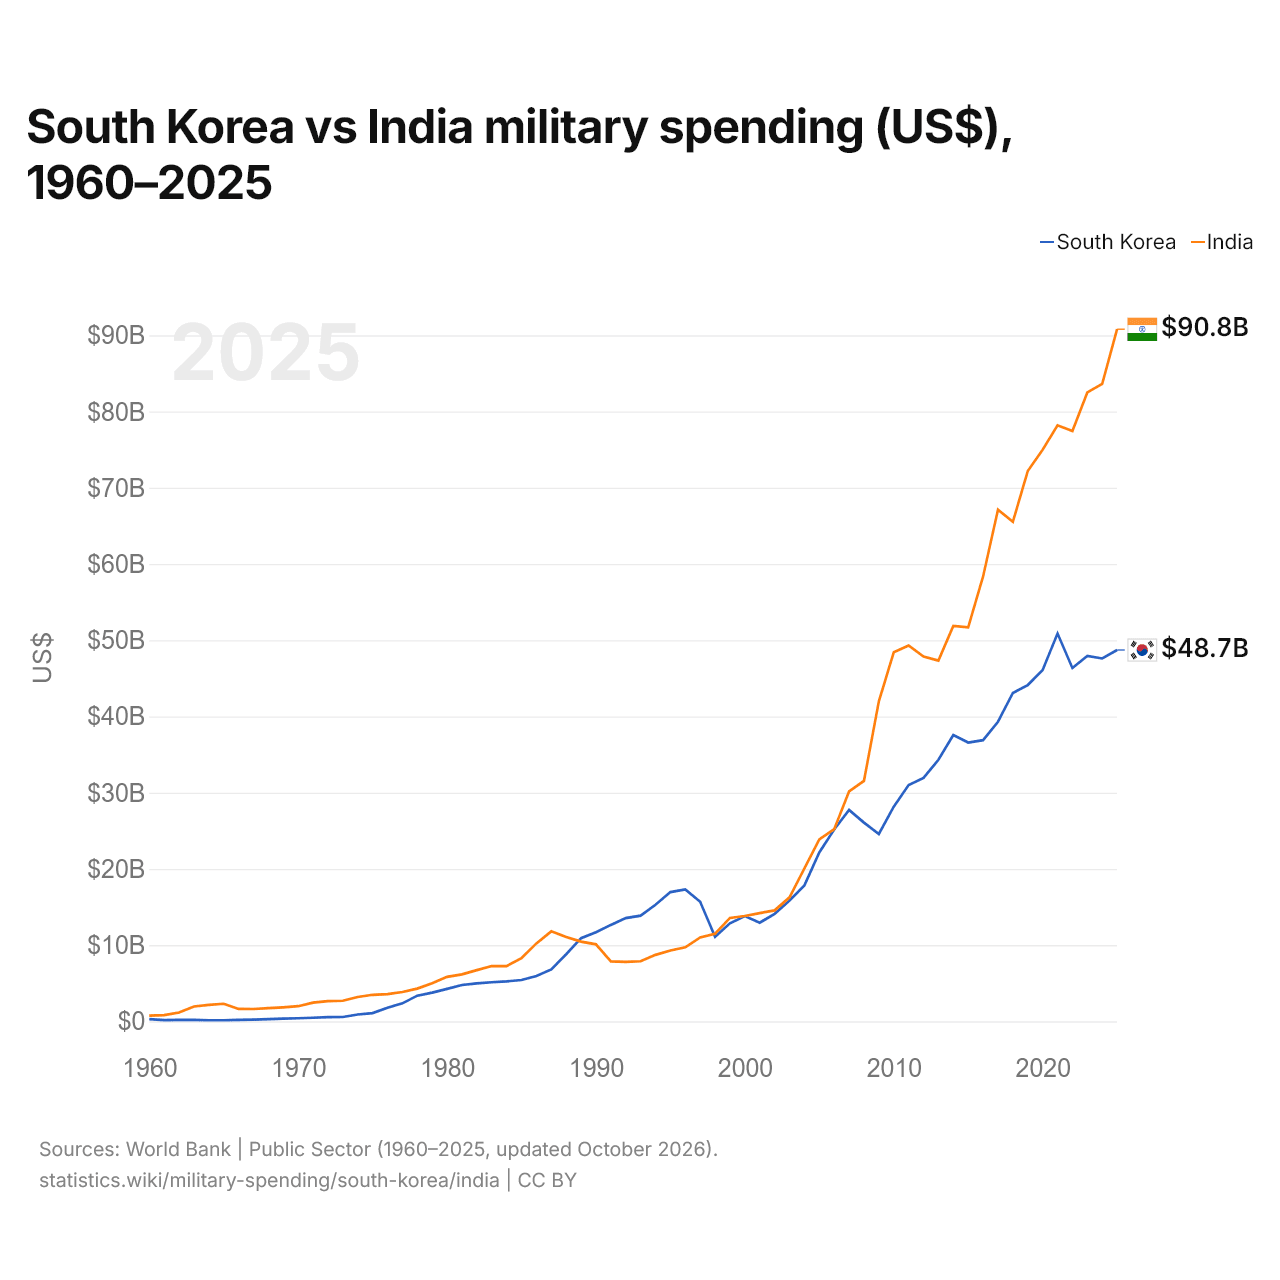
En 2025, el gasto militar fue de 48,7 mil millones de US$ en Corea del Sur y de 90,8 mil millones de US$ en la India: 1,9 veces más en la India. En 1960 fue de 284 millones de US$ en Corea del Sur y de 742 millones de US$ en la India, 2,6 veces más en la India.
Corea del Sur vs India: gasto militar en % del PIB, 1960–2025
| Año | % del PIB | |
|---|---|---|
|
Corea del Sur
|
India
|
|
| 2025 | 2,6 % | 2,3 % |
| 2024 | 2,5 % | 2,2 % |
| 2023 | 2,6 % | 2,4 % |
| 2022 | 2,6 % | 2,4 % |
| 2021 | 2,6 % | 2,5 % |
| 2020 | 2,6 % | 2,8 % |
| 2019 | 2,5 % | 2,5 % |
| 2018 | 2,4 % | 2,4 % |
| 2017 | 2,3 % | 2,5 % |
| 2016 | 2,3 % | 2,5 % |
| 2015 | 2,4 % | 2,5 % |
| 2014 | 2,4 % | 2,5 % |
| 2013 | 2,4 % | 2,5 % |
| 2012 | 2,4 % | 2,6 % |
| 2011 | 2,4 % | 2,7 % |
| 2010 | 2,4 % | 2,9 % |
| 2009 | 2,5 % | 3,1 % |
| 2008 | 2,4 % | 2,6 % |
| 2007 | 2,3 % | 2,5 % |
| 2006 | 2,3 % | 2,7 % |
| 2005 | 2,3 % | 2,9 % |
| 2004 | 2,2 % | 2,8 % |
| 2003 | 2,2 % | 2,7 % |
| 2002 | 2,2 % | 2,8 % |
| 2001 | 2,3 % | 2,9 % |
| 2000 | 2,3 % | 2,9 % |
| 1999 | 2,5 % | 3 % |
| 1998 | 2,8 % | 2,7 % |
| 1997 | 2,7 % | 2,6 % |
| 1996 | 2,7 % | 2,5 % |
| 1995 | 2,9 % | 2,6 % |
| 1994 | 3,2 % | 2,7 % |
| 1993 | 3,4 % | 2,8 % |
| 1992 | 3,7 % | 2,7 % |
| 1991 | 3,7 % | 2,9 % |
| 1990 | 4 % | 3,1 % |
| 1989 | 4,3 % | 3,5 % |
| 1988 | 4,3 % | 3,7 % |
| 1987 | 4,5 % | 4,2 % |
| 1986 | 4,9 % | 4,1 % |
| 1985 | 5,2 % | 3,6 % |
| 1984 | 5,3 % | 3,4 % |
| 1983 | 5,7 % | 3,3 % |
| 1982 | 6,2 % | 3,3 % |
| 1981 | 6,4 % | 3,2 % |
| 1980 | 6,4 % | 3,1 % |
| 1979 | 5,5 % | 3,3 % |
| 1978 | 6,4 % | 3,1 % |
| 1977 | 6 % | 3,2 % |
| 1976 | 5,9 % | 3,5 % |
| 1975 | 4,9 % | 3,5 % |
| 1974 | 4,5 % | 3,2 % |
| 1973 | 4 % | 3,2 % |
| 1972 | 5 % | 3,7 % |
| 1971 | 4,7 % | 3,7 % |
| 1970 | 4,4 % | 3,2 % |
| 1969 | 4,7 % | 3,1 % |
| 1968 | 4,7 % | 3,2 % |
| 1967 | 4,7 % | 3,2 % |
| 1966 | 4,7 % | 3,6 % |
| 1965 | 4,4 % | 3,9 % |
| 1964 | 4,1 % | 3,8 % |
| 1963 | 4,8 % | 4 % |
| 1962 | 6,9 % | 2,7 % |
| 1961 | 6,7 % | 2,1 % |
| 1960 | 7,2 % | 2 % |
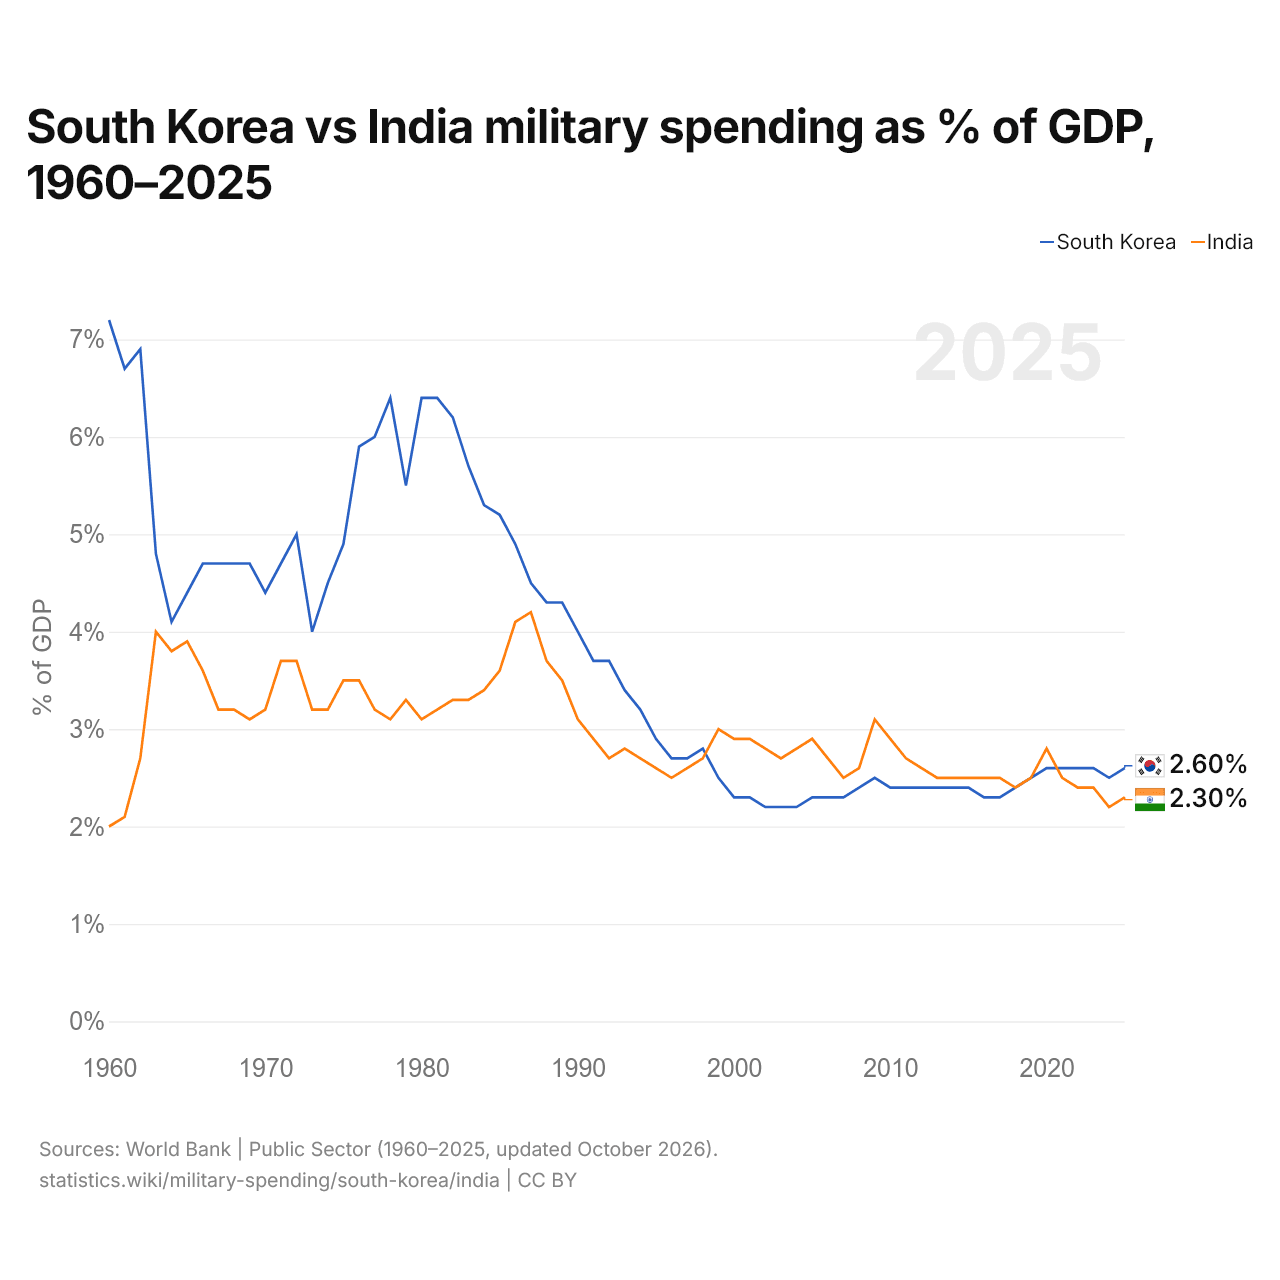
En 2025, el gasto militar fue del 2,6 % del PIB en Corea del Sur y del 2,3 % en la India: 0,3 puntos porcentuales más en Corea del Sur. En 2015 fue del 2,4 % en Corea del Sur y del 2,5 % en la India, 0,1 puntos porcentuales más en la India.
El gasto militar de Corea del Sur, como porcentaje del PIB, ha sido más alto que el de la India todos los años desde 2021.
Corea del Sur vs India: datos del gasto militar
|
Corea del Sur
|
India
|
|
|---|---|---|
| US$, 2025 | 48,7 mil M US$ | 90,8 mil M US$ |
| % del PIB, 2025 | 2,6 % | 2,3 % |
| Por persona, US$ | 942 US$ | 62 US$ |
| Porcentaje del mundo | 1,71 % | 3,18 % |
| Puesto mundial | 11/154 | 6/154 |
Comparar el gasto militar de 2 países cualesquiera
Fuentes:
- Banco Mundial | Sector público (1960–2025, actualizado en octubre de 2026)
Creative Commons Atribución (CC BY): puedes copiar, compartir, adaptar y reutilizar este contenido, también con fines comerciales, siempre que cites a statistics.wiki e indiques los cambios que hayas hecho. Las fuentes indicadas arriba pueden tener sus propias condiciones de licencia.