
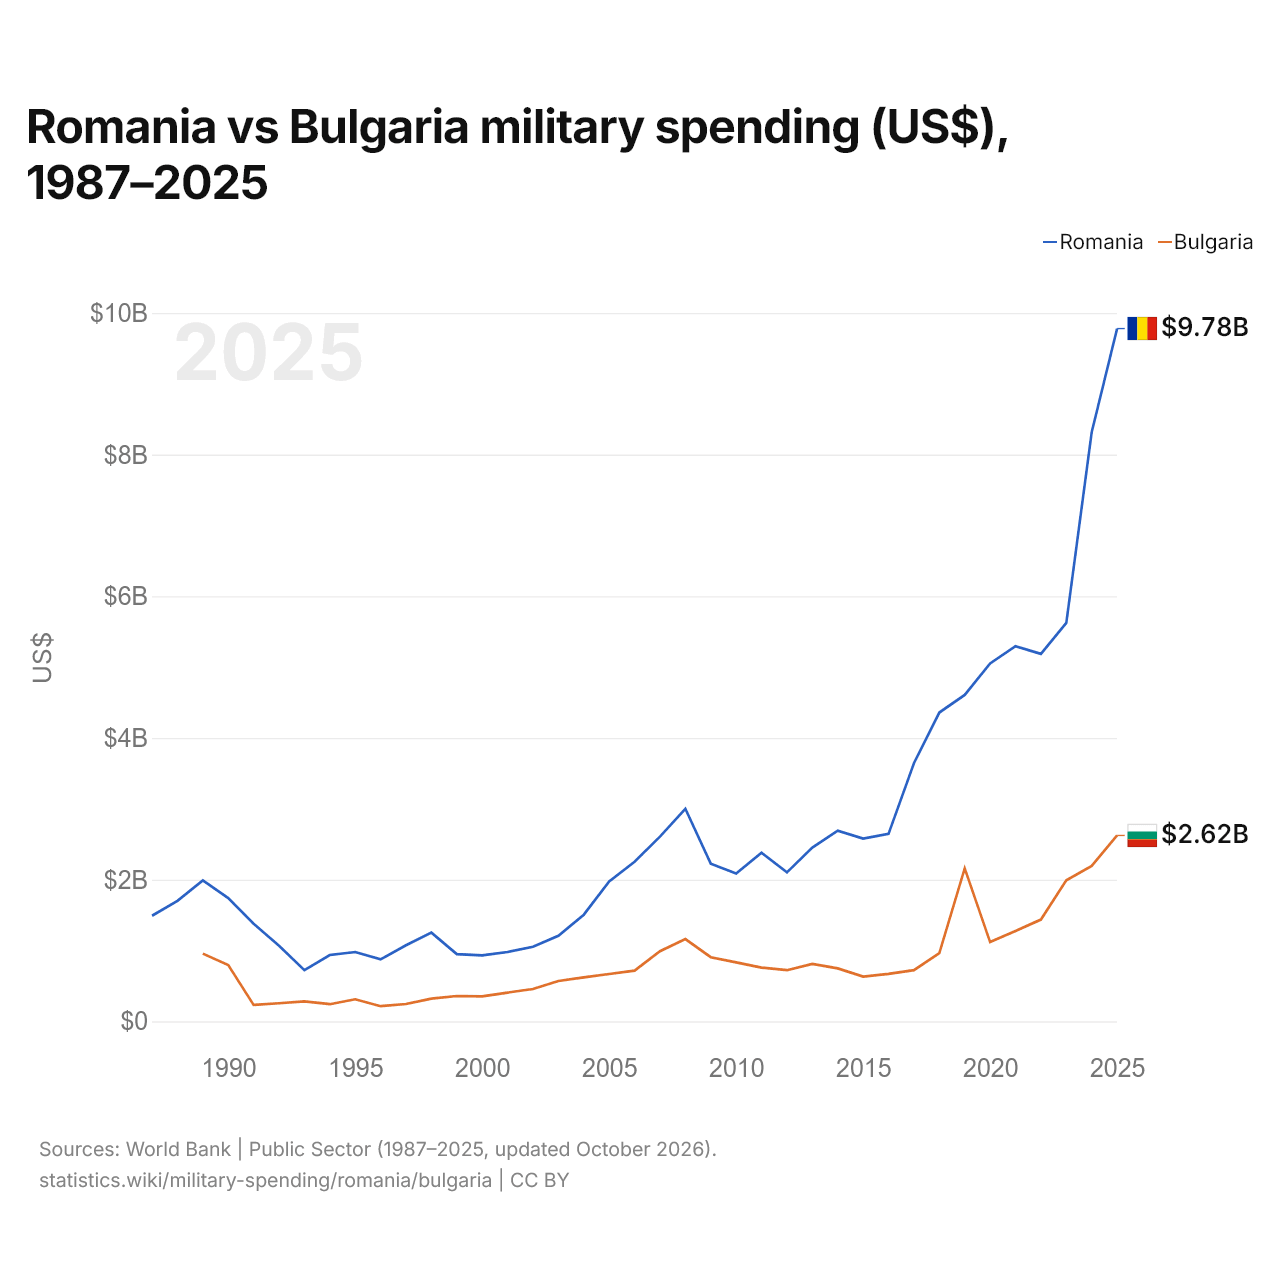
Rumanía vs Bulgaria: gasto militar (US$), 1987–2025
| Año | US$ | |
|---|---|---|
 Rumanía |
 Bulgaria |
|
| 2025 | 9.778.858.161 US$ | 2.623.881.207 US$ |
| 2024 | 8.315.327.070 US$ | 2.192.781.567 US$ |
| 2023 | 5.624.969.941 US$ | 1.991.293.477 US$ |
| 2022 | 5.186.520.209 US$ | 1.436.522.983 US$ |
| 2021 | 5.294.923.565 US$ | 1.275.329.354 US$ |
| 2020 | 5.051.131.009 US$ | 1.118.721.178 US$ |
| 2019 | 4.607.679.466 US$ | 2.158.616.040 US$ |
| 2018 | 4.358.870.991 US$ | 961.400.780 US$ |
| 2017 | 3.643.441.024 US$ | 723.188.999 US$ |
| 2016 | 2.645.404.585 US$ | 670.832.814 US$ |
| 2015 | 2.580.612.052 US$ | 632.541.955 US$ |
| 2014 | 2.691.585.370 US$ | 747.570.945 US$ |
| 2013 | 2.452.635.953 US$ | 811.677.474 US$ |
| 2012 | 2.102.703.443 US$ | 722.089.379 US$ |
| 2011 | 2.380.001.520 US$ | 757.971.114 US$ |
| 2010 | 2.086.649.800 US$ | 832.590.769 US$ |
| 2009 | 2.225.253.810 US$ | 905.006.277 US$ |
| 2008 | 3.000.389.542 US$ | 1.161.513.352 US$ |
| 2007 | 2.607.689.942 US$ | 990.218.761 US$ |
| 2006 | 2.251.491.020 US$ | 715.757.530 US$ |
| 2005 | 1.975.973.117 US$ | 667.703.203 US$ |
| 2004 | 1.505.214.291 US$ | 620.941.108 US$ |
| 2003 | 1.207.278.895 US$ | 569.082.503 US$ |
| 2002 | 1.053.654.435 US$ | 455.974.828 US$ |
| 2001 | 977.862.841 US$ | 406.024.648 US$ |
| 2000 | 930.938.981 US$ | 351.362.050 US$ |
| 1999 | 949.256.553 US$ | 357.242.169 US$ |
| 1998 | 1.252.623.514 US$ | 320.405.719 US$ |
| 1997 | 1.073.535.434 US$ | 244.382.046 US$ |
| 1996 | 875.066.226 US$ | 213.627.199 US$ |
| 1995 | 978.217.705 US$ | 311.160.993 US$ |
| 1994 | 936.686.204 US$ | 242.013.949 US$ |
| 1993 | 722.456.076 US$ | 282.637.386 US$ |
| 1992 | 1.067.088.643 US$ | 255.731.948 US$ |
| 1991 | 1.377.137.357 US$ | 232.160.978 US$ |
| 1990 | 1.739.289.956 US$ | 794.542.715 US$ |
| 1989 | 1.988.516.524 US$ | 956.025.630 US$ |
| 1988 | 1.700.041.658 US$ | - |
| 1987 | 1.489.975.490 US$ | - |
En 2025, el gasto militar fue de 9,78 mil millones de US$ en Rumanía y de 2,62 mil millones de US$ en Bulgaria: 3,7 veces más en Rumanía. En 1989 fue de 1,99 mil millones de US$ en Rumanía y de 956 millones de US$ en Bulgaria, 2,1 veces más en Rumanía.
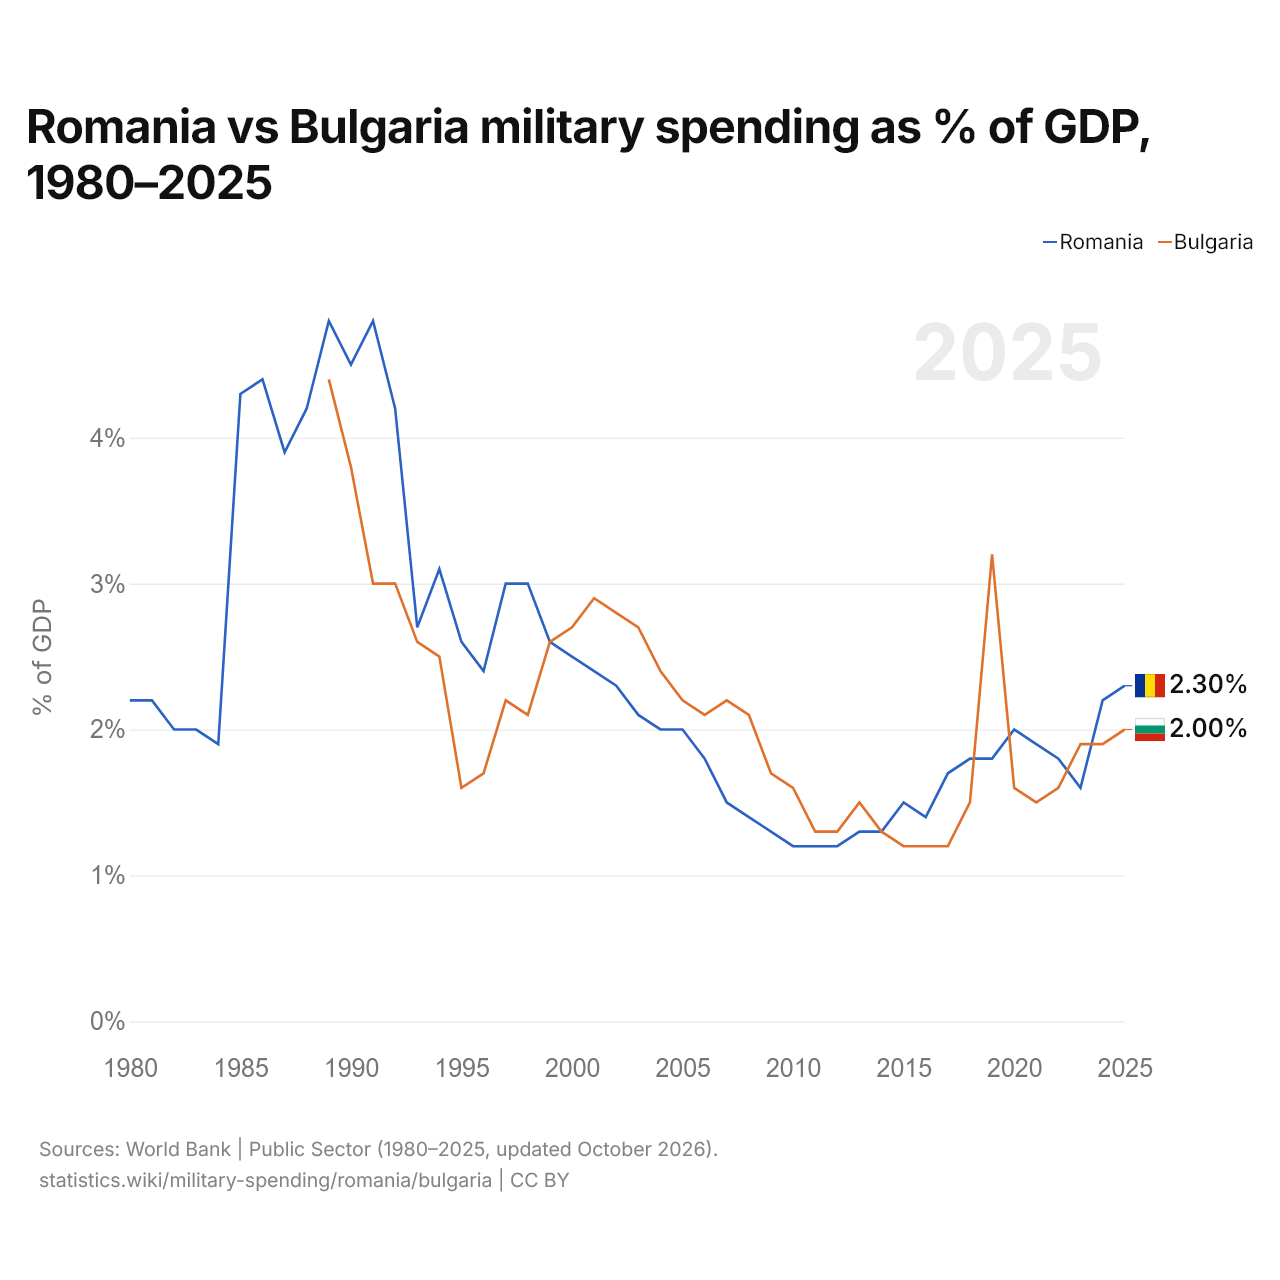
Rumanía vs Bulgaria: gasto militar en % del PIB, 1980–2025
| Año | % del PIB | |
|---|---|---|
|
Rumanía
|
Bulgaria
|
|
| 2025 | 2,3 % | 2 % |
| 2024 | 2,2 % | 1,9 % |
| 2023 | 1,6 % | 1,9 % |
| 2022 | 1,8 % | 1,6 % |
| 2021 | 1,9 % | 1,5 % |
| 2020 | 2 % | 1,6 % |
| 2019 | 1,8 % | 3,2 % |
| 2018 | 1,8 % | 1,5 % |
| 2017 | 1,7 % | 1,2 % |
| 2016 | 1,4 % | 1,2 % |
| 2015 | 1,5 % | 1,2 % |
| 2014 | 1,3 % | 1,3 % |
| 2013 | 1,3 % | 1,5 % |
| 2012 | 1,2 % | 1,3 % |
| 2011 | 1,2 % | 1,3 % |
| 2010 | 1,2 % | 1,6 % |
| 2009 | 1,3 % | 1,7 % |
| 2008 | 1,4 % | 2,1 % |
| 2007 | 1,5 % | 2,2 % |
| 2006 | 1,8 % | 2,1 % |
| 2005 | 2 % | 2,2 % |
| 2004 | 2 % | 2,4 % |
| 2003 | 2,1 % | 2,7 % |
| 2002 | 2,3 % | 2,8 % |
| 2001 | 2,4 % | 2,9 % |
| 2000 | 2,5 % | 2,7 % |
| 1999 | 2,6 % | 2,6 % |
| 1998 | 3 % | 2,1 % |
| 1997 | 3 % | 2,2 % |
| 1996 | 2,4 % | 1,7 % |
| 1995 | 2,6 % | 1,6 % |
| 1994 | 3,1 % | 2,5 % |
| 1993 | 2,7 % | 2,6 % |
| 1992 | 4,2 % | 3 % |
| 1991 | 4,8 % | 3 % |
| 1990 | 4,5 % | 3,8 % |
| 1989 | 4,8 % | 4,4 % |
| 1988 | 4,2 % | - |
| 1987 | 3,9 % | - |
| 1986 | 4,4 % | - |
| 1985 | 4,3 % | - |
| 1984 | 1,9 % | - |
| 1983 | 2 % | - |
| 1982 | 2 % | - |
| 1981 | 2,2 % | - |
| 1980 | 2,2 % | - |
En 2025, el gasto militar fue del 2,3 % del PIB en Rumanía y del 2,0 % en Bulgaria: 0,3 puntos porcentuales más en Rumanía. En 2015 fue del 1,5 % en Rumanía y del 1,2 % en Bulgaria, 0,3 puntos porcentuales más en Rumanía.
La diferencia fue máxima en 1991, cuando el gasto militar de Rumanía superó al de Bulgaria en 1,8 puntos porcentuales del PIB.
Rumanía vs Bulgaria: datos del gasto militar
|
Rumanía
|
Bulgaria
|
|
|---|---|---|
| US$, 2025 | 9780 M US$ | 2620 M US$ |
| % del PIB, 2025 | 2,3 % | 2,0 % |
| Por persona, US$ | 514 US$ | 408 US$ |
| Porcentaje del mundo | 0,34 % | 0,09 % |
| Puesto mundial | 33/154 | 63/154 |
Comparar el gasto militar de 2 países cualesquiera
Fuentes:
- Banco Mundial | Sector público (1980–2025, actualizado en octubre de 2026)
Creative Commons Atribución (CC BY): puedes copiar, compartir, adaptar y reutilizar este contenido, también con fines comerciales, siempre que cites a statistics.wiki e indiques los cambios que hayas hecho. Las fuentes indicadas arriba pueden tener sus propias condiciones de licencia.