
Nigeria vs Níger: exportaciones de servicios de TI y de propiedad intelectual, 2000–2025 (incluye telecomunicaciones)
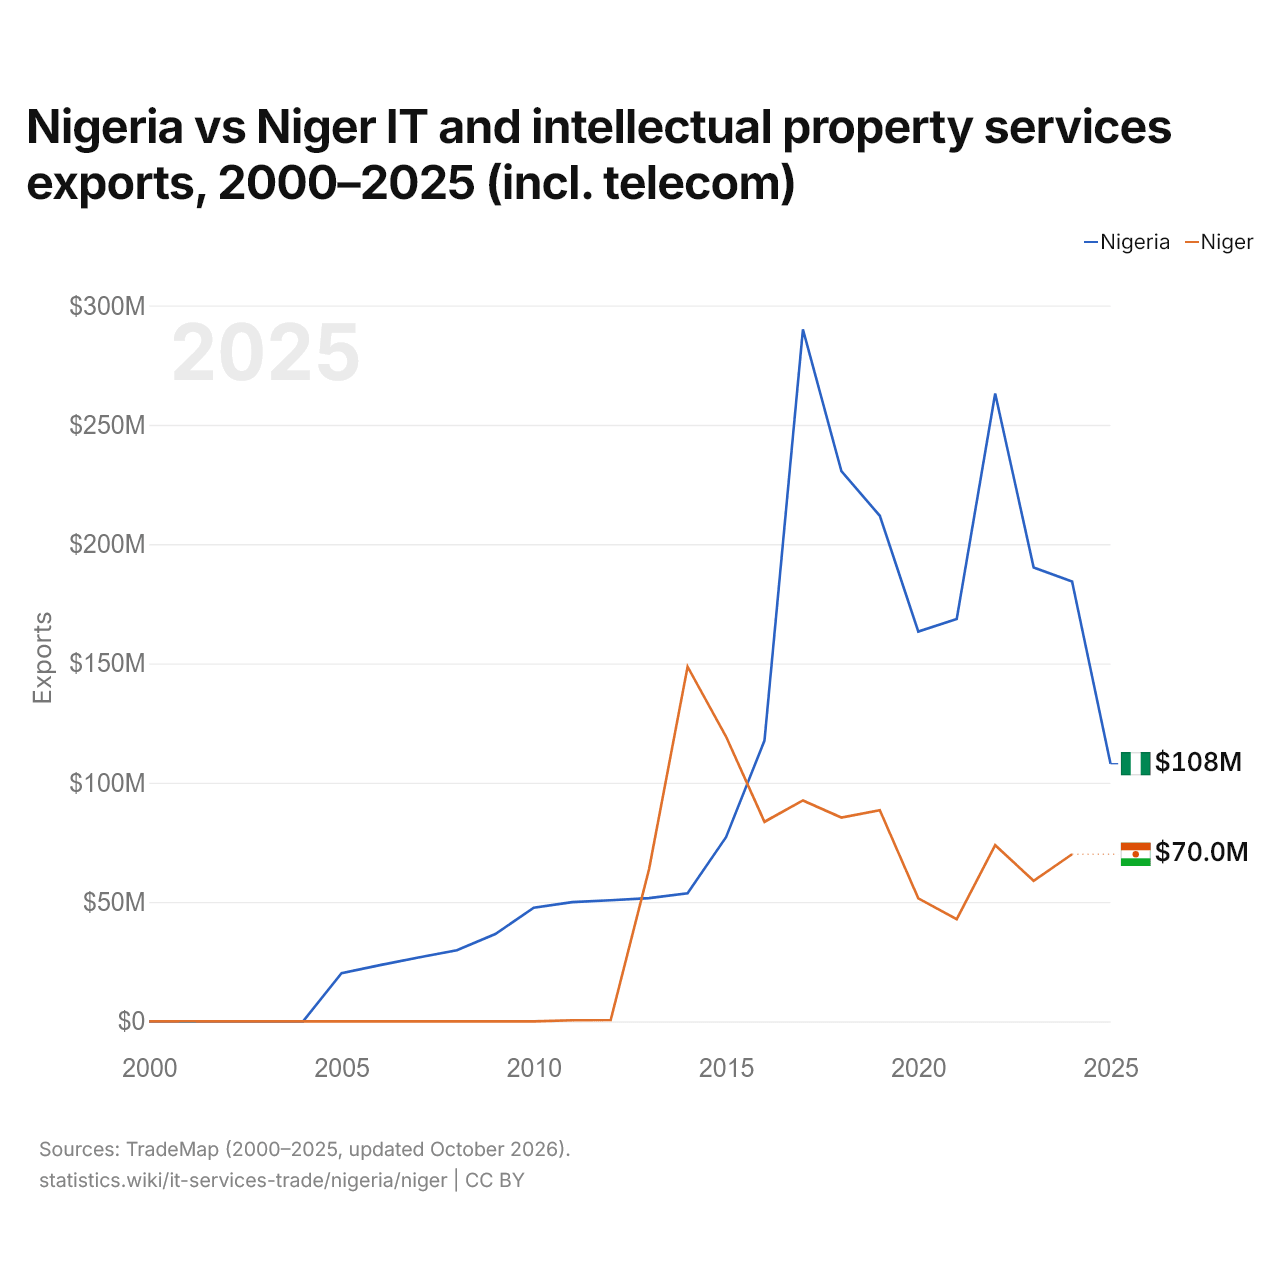
| Año | Exportaciones | |
|---|---|---|
 Nigeria |
 Níger |
|
| 2025 | 107.970.000 US$ | - |
| 2024 | 184.350.000 US$ | 70.030.000 US$ |
| 2023 | 190.250.000 US$ | 58.890.000 US$ |
| 2022 | 263.150.000 US$ | 73.820.000 US$ |
| 2021 | 168.600.000 US$ | 42.790.000 US$ |
| 2020 | 163.385.000 US$ | 51.527.000 US$ |
| 2019 | 211.875.000 US$ | 88.469.000 US$ |
| 2018 | 230.570.000 US$ | 85.393.000 US$ |
| 2017 | 290.045.000 US$ | 92.588.000 US$ |
| 2016 | 117.652.000 US$ | 83.627.000 US$ |
| 2015 | 77.184.000 US$ | 119.356.000 US$ |
| 2014 | 53.640.000 US$ | 148.636.000 US$ |
| 2013 | 51.657.000 US$ | 63.904.000 US$ |
| 2012 | 50.742.000 US$ | 554.000 US$ |
| 2011 | 49.988.000 US$ | 441.000 US$ |
| 2010 | 47.603.000 US$ | 0 US$ |
| 2009 | 36.595.000 US$ | 0 US$ |
| 2008 | 29.811.000 US$ | 0 US$ |
| 2007 | 26.770.000 US$ | 2.000 US$ |
| 2006 | 23.550.000 US$ | 0 US$ |
| 2005 | 20.217.000 US$ | 8.000 US$ |
| 2004 | 0 US$ | 0 US$ |
| 2003 | 0 US$ | 0 US$ |
| 2002 | 0 US$ | 0 US$ |
| 2001 | 0 US$ | 34.000 US$ |
| 2000 | 0 US$ | 0 US$ |
Las exportaciones de servicios de TI y de propiedad intelectual de Nigeria fueron de 184 millones de US$ (2024) y las de Níger, de 70 millones de US$ (2024): las de Nigeria fueron 2,6 veces mayores. En 2000, las exportaciones de Nigeria y las de Níger fueron iguales, de 0 US$.
Las exportaciones de servicios de TI y de propiedad intelectual de Nigeria han sido mayores que las de Níger todos los años desde 2016.
Nigeria vs Níger: importaciones de servicios de TI y de propiedad intelectual, 2000–2025
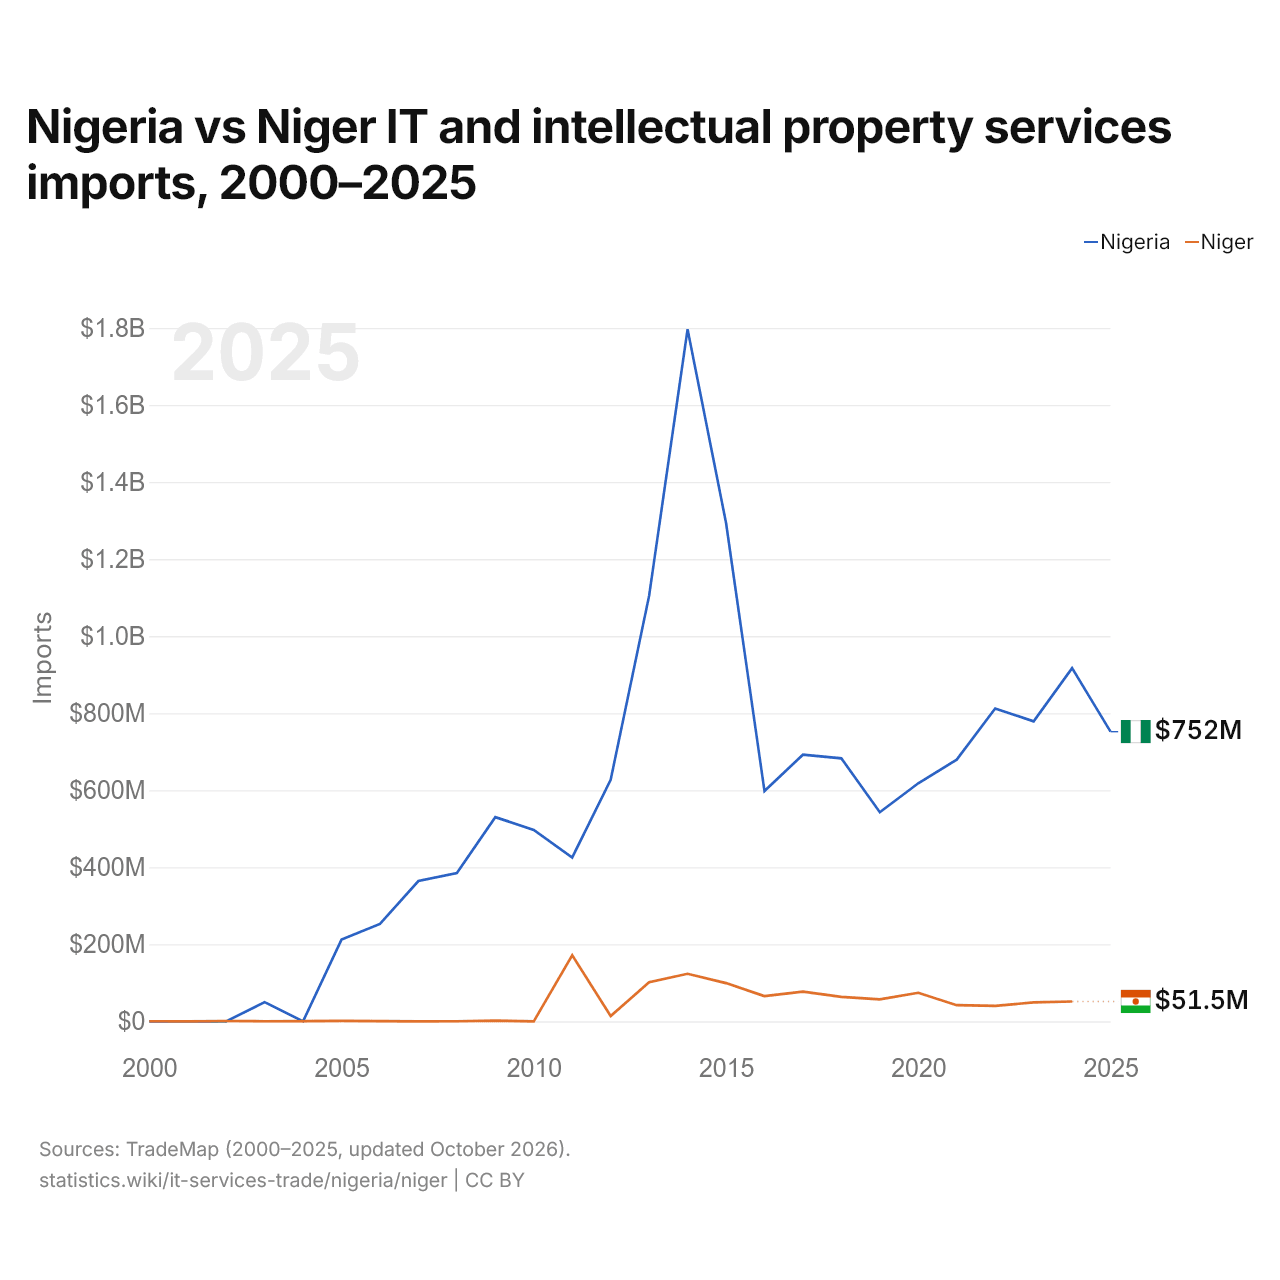
| Año | Importaciones | |
|---|---|---|
|
Nigeria
|
Níger
|
|
| 2025 | 751.980.000 US$ | - |
| 2024 | 916.980.000 US$ | 51.510.000 US$ |
| 2023 | 778.790.000 US$ | 49.110.000 US$ |
| 2022 | 812.090.000 US$ | 40.290.000 US$ |
| 2021 | 679.320.000 US$ | 41.870.000 US$ |
| 2020 | 617.951.000 US$ | 74.171.000 US$ |
| 2019 | 542.726.000 US$ | 56.890.000 US$ |
| 2018 | 682.666.000 US$ | 63.426.000 US$ |
| 2017 | 692.231.000 US$ | 76.993.000 US$ |
| 2016 | 597.908.000 US$ | 65.402.000 US$ |
| 2015 | 1.294.334.000 US$ | 99.247.000 US$ |
| 2014 | 1.796.553.000 US$ | 123.417.000 US$ |
| 2013 | 1.104.972.000 US$ | 101.711.000 US$ |
| 2012 | 626.973.000 US$ | 13.577.000 US$ |
| 2011 | 425.341.000 US$ | 171.521.000 US$ |
| 2010 | 496.989.000 US$ | 0 US$ |
| 2009 | 530.049.000 US$ | 1.991.000 US$ |
| 2008 | 385.186.000 US$ | 281.000 US$ |
| 2007 | 364.275.000 US$ | 98.000 US$ |
| 2006 | 252.839.000 US$ | 486.000 US$ |
| 2005 | 212.207.000 US$ | 1.139.000 US$ |
| 2004 | 0 US$ | 490.000 US$ |
| 2003 | 49.853.000 US$ | 248.000 US$ |
| 2002 | 0 US$ | 789.000 US$ |
| 2001 | 0 US$ | 10.000 US$ |
| 2000 | 0 US$ | 194.000 US$ |
Las importaciones de servicios de TI y de propiedad intelectual de Nigeria fueron de 917 millones de US$ (2024) y las de Níger, de 51,5 millones de US$ (2024): las de Nigeria fueron 18 veces mayores. En 2000, las importaciones fueron de 0 US$ de Nigeria y de 194.000 US$ de Níger.
Nigeria vs Níger: cifras del comercio de servicios de TI y de propiedad intelectual
|
Nigeria
|
Níger
|
|
|---|---|---|
| Exportaciones | 108 M US$ (2025) | 70,0 M US$ (2024) |
| Importaciones | 752 M US$ (2025) | 51,5 M US$ (2024) |
| Saldo | −644 M US$ (2025) | +18,5 M US$ (2024) |
| Porcentaje del mundo | 0,005 % | 0,004 % |
| Puesto mundial | 107/179 | 115/179 |
| Principal comprador | n/d | n/d |
| Principal proveedor | n/d | n/d |
Comparar el comercio de servicios de TI y de propiedad intelectual de 2 países cualesquiera
Fuentes:
- TradeMap (2000–2025, actualizado en octubre de 2026)
Creative Commons Atribución (CC BY): puedes copiar, compartir, adaptar y reutilizar este contenido, también con fines comerciales, siempre que cites a statistics.wiki e indiques los cambios que hayas hecho. Las fuentes indicadas arriba pueden tener sus propias condiciones de licencia.