
Nigeria vs Irán: exportaciones de servicios de TI y de propiedad intelectual, 2000–2025 (incluye telecomunicaciones)
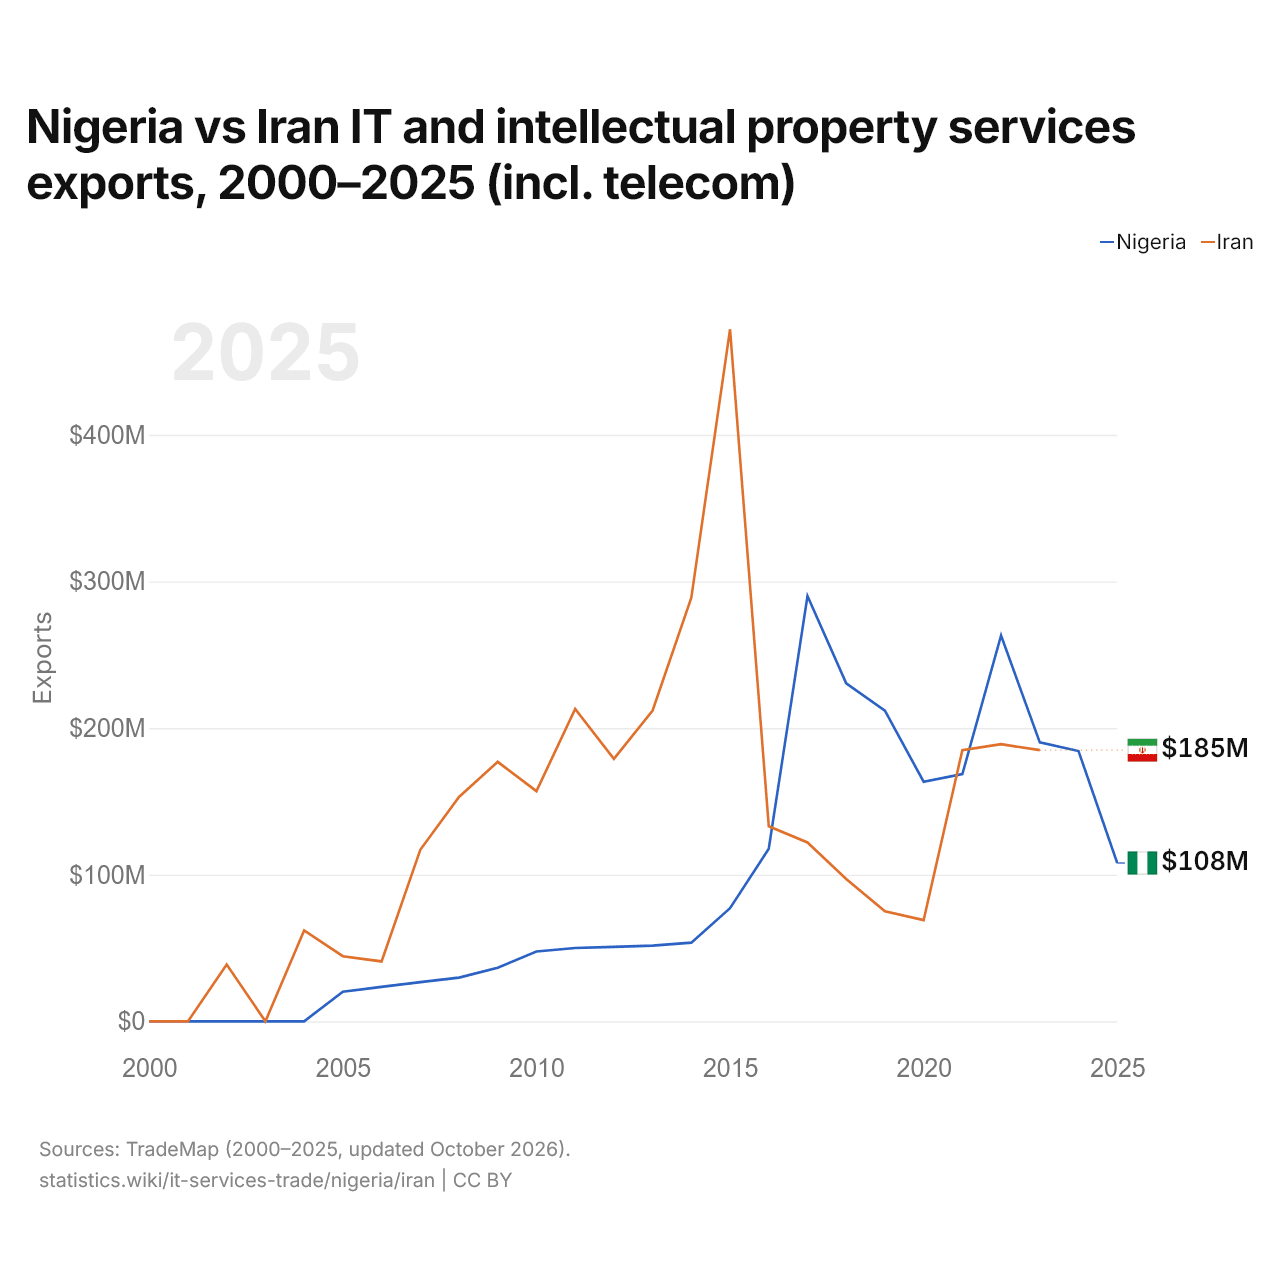
| Año | Exportaciones | |
|---|---|---|
 Nigeria |
 Irán |
|
| 2025 | 107.970.000 US$ | - |
| 2024 | 184.350.000 US$ | - |
| 2023 | 190.250.000 US$ | 185.000.000 US$ |
| 2022 | 263.150.000 US$ | 189.000.000 US$ |
| 2021 | 168.600.000 US$ | 185.000.000 US$ |
| 2020 | 163.385.000 US$ | 69.000.000 US$ |
| 2019 | 211.875.000 US$ | 75.000.000 US$ |
| 2018 | 230.570.000 US$ | 97.000.000 US$ |
| 2017 | 290.045.000 US$ | 122.000.000 US$ |
| 2016 | 117.652.000 US$ | 133.000.000 US$ |
| 2015 | 77.184.000 US$ | 472.000.000 US$ |
| 2014 | 53.640.000 US$ | 289.000.000 US$ |
| 2013 | 51.657.000 US$ | 212.000.000 US$ |
| 2012 | 50.742.000 US$ | 179.000.000 US$ |
| 2011 | 49.988.000 US$ | 213.000.000 US$ |
| 2010 | 47.603.000 US$ | 157.000.000 US$ |
| 2009 | 36.595.000 US$ | 177.000.000 US$ |
| 2008 | 29.811.000 US$ | 153.000.000 US$ |
| 2007 | 26.770.000 US$ | 117.000.000 US$ |
| 2006 | 23.550.000 US$ | 40.850.000 US$ |
| 2005 | 20.217.000 US$ | 44.392.000 US$ |
| 2004 | 0 US$ | 61.957.000 US$ |
| 2003 | 0 US$ | 0 US$ |
| 2002 | 0 US$ | 38.705.000 US$ |
| 2001 | 0 US$ | 0 US$ |
| 2000 | 0 US$ | 0 US$ |
Las exportaciones de servicios de TI y de propiedad intelectual de Nigeria fueron de 190 millones de US$ (2023) y las de Irán, de 185 millones de US$ (2023): las de Nigeria fueron un 2,8 % mayores. En 2000, las exportaciones de Nigeria y las de Irán fueron iguales, de 0 US$.
Nigeria vs Irán: importaciones de servicios de TI y de propiedad intelectual, 2000–2025
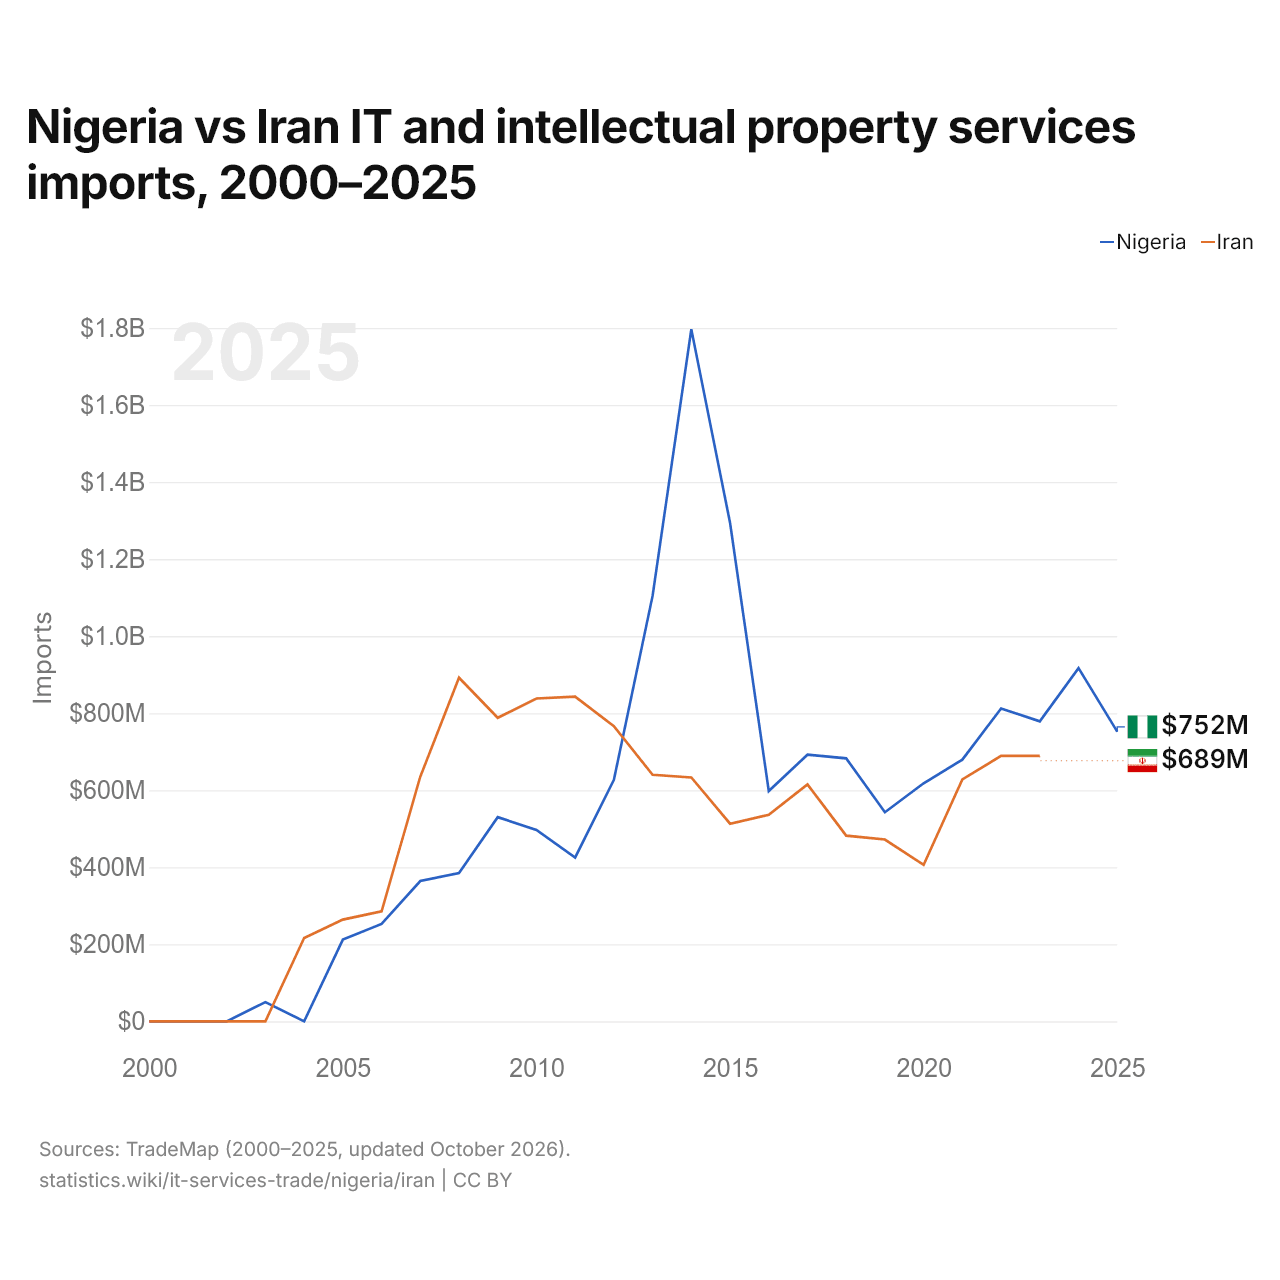
| Año | Importaciones | |
|---|---|---|
|
Nigeria
|
Irán
|
|
| 2025 | 751.980.000 US$ | - |
| 2024 | 916.980.000 US$ | - |
| 2023 | 778.790.000 US$ | 689.000.000 US$ |
| 2022 | 812.090.000 US$ | 689.000.000 US$ |
| 2021 | 679.320.000 US$ | 628.000.000 US$ |
| 2020 | 617.951.000 US$ | 406.000.000 US$ |
| 2019 | 542.726.000 US$ | 472.000.000 US$ |
| 2018 | 682.666.000 US$ | 482.000.000 US$ |
| 2017 | 692.231.000 US$ | 615.000.000 US$ |
| 2016 | 597.908.000 US$ | 536.000.000 US$ |
| 2015 | 1.294.334.000 US$ | 513.000.000 US$ |
| 2014 | 1.796.553.000 US$ | 633.000.000 US$ |
| 2013 | 1.104.972.000 US$ | 640.000.000 US$ |
| 2012 | 626.973.000 US$ | 766.000.000 US$ |
| 2011 | 425.341.000 US$ | 843.000.000 US$ |
| 2010 | 496.989.000 US$ | 838.000.000 US$ |
| 2009 | 530.049.000 US$ | 788.000.000 US$ |
| 2008 | 385.186.000 US$ | 892.000.000 US$ |
| 2007 | 364.275.000 US$ | 635.000.000 US$ |
| 2006 | 252.839.000 US$ | 285.387.000 US$ |
| 2005 | 212.207.000 US$ | 264.162.000 US$ |
| 2004 | 0 US$ | 216.547.000 US$ |
| 2003 | 49.853.000 US$ | 0 US$ |
| 2002 | 0 US$ | 0 US$ |
| 2001 | 0 US$ | 0 US$ |
| 2000 | 0 US$ | 0 US$ |
Las importaciones de servicios de TI y de propiedad intelectual de Nigeria fueron de 779 millones de US$ (2023) y las de Irán, de 689 millones de US$ (2023): las de Nigeria fueron un 13 % mayores. En 2000, las importaciones de Nigeria y las de Irán fueron iguales, de 0 US$.
Nigeria vs Irán: cifras del comercio de servicios de TI y de propiedad intelectual
|
Nigeria
|
Irán
|
|
|---|---|---|
| Exportaciones | 108 M US$ (2025) | 185 M US$ (2023) |
| Importaciones | 752 M US$ (2025) | 689 M US$ (2023) |
| Saldo | −644 M US$ (2025) | −504 M US$ (2023) |
| Porcentaje del mundo | 0,005 % | 0,01 % |
| Puesto mundial | 107/179 | 95/179 |
| Principal comprador | n/d | n/d |
| Principal proveedor | n/d | n/d |
Comparar el comercio de servicios de TI y de propiedad intelectual de 2 países cualesquiera
Fuentes:
- TradeMap (2000–2025, actualizado en octubre de 2026)
Creative Commons Atribución (CC BY): puedes copiar, compartir, adaptar y reutilizar este contenido, también con fines comerciales, siempre que cites a statistics.wiki e indiques los cambios que hayas hecho. Las fuentes indicadas arriba pueden tener sus propias condiciones de licencia.