
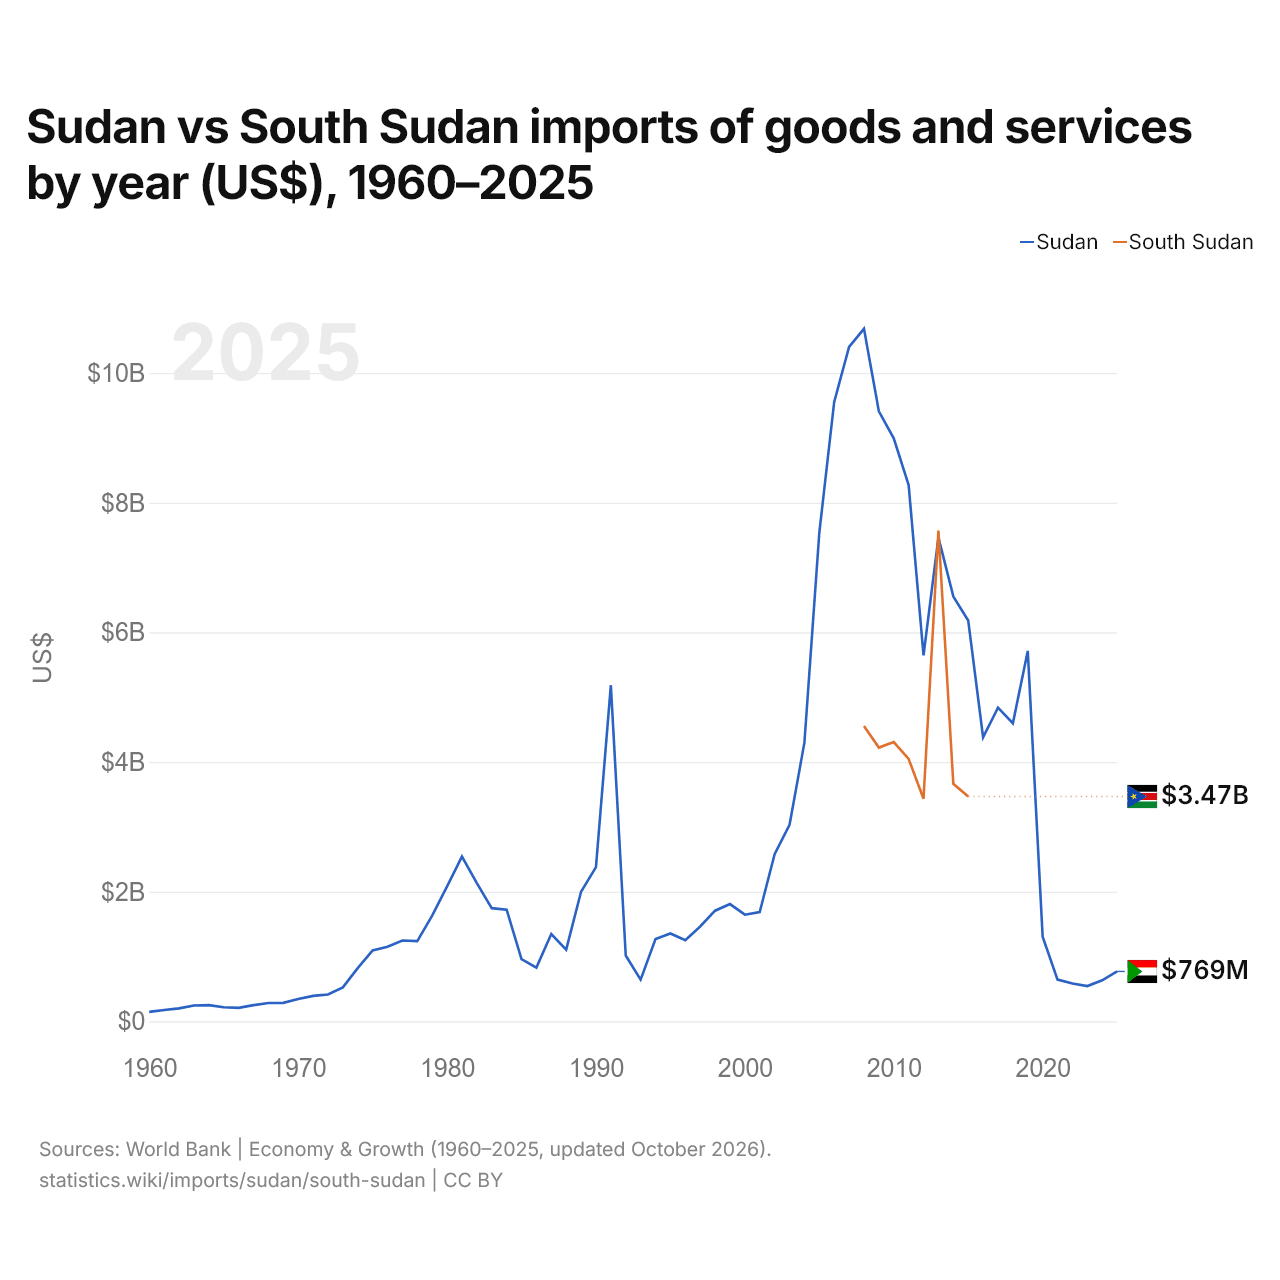
Sudán vs Sudán del Sur: importaciones de bienes y servicios por año (US$), 1960–2025
1x
| Año | US$ | |
|---|---|---|
 Sudán |
 Sudán del Sur |
|
| 2025 | 769.412.869 US$ | - |
| 2024 | 633.066.206 US$ | - |
| 2023 | 544.859.101 US$ | - |
| 2022 | 582.633.199 US$ | - |
| 2021 | 642.720.122 US$ | - |
| 2020 | 1.305.725.563 US$ | - |
| 2019 | 5.713.051.071 US$ | - |
| 2018 | 4.597.125.307 US$ | - |
| 2017 | 4.838.128.571 US$ | - |
| 2016 | 4.381.200.000 US$ | - |
| 2015 | 6.184.121.212 US$ | 3.467.364.408 US$ |
| 2014 | 6.554.134.831 US$ | 3.664.089.627 US$ |
| 2013 | 7.465.369.863 US$ | 7.567.840.881 US$ |
| 2012 | 5.644.833.333 US$ | 3.434.803.458 US$ |
| 2011 | 8.271.289.474 US$ | 4.047.444.597 US$ |
| 2010 | 8.993.448.276 US$ | 4.308.920.517 US$ |
| 2009 | 9.408.802.692 US$ | 4.222.409.862 US$ |
| 2008 | 10.681.682.386 US$ | 4.556.634.294 US$ |
| 2007 | 10.403.689.996 US$ | - |
| 2006 | 9.554.139.449 US$ | - |
| 2005 | 7.533.593.043 US$ | - |
| 2004 | 4.298.519.416 US$ | - |
| 2003 | 3.029.824.387 US$ | - |
| 2002 | 2.578.370.321 US$ | - |
| 2001 | 1.686.810.041 US$ | - |
| 2000 | 1.644.890.004 US$ | - |
| 1999 | 1.808.997.333 US$ | - |
| 1998 | 1.707.000.780 US$ | - |
| 1997 | 1.461.894.484 US$ | - |
| 1996 | 1.250.799.493 US$ | - |
| 1995 | 1.355.784.559 US$ | - |
| 1994 | 1.269.090.394 US$ | - |
| 1993 | 642.630.277 US$ | - |
| 1992 | 1.014.351.939 US$ | - |
| 1991 | 5.184.280.866 US$ | - |
| 1990 | 2.377.777.778 US$ | - |
| 1989 | 2.000.000.000 US$ | - |
| 1988 | 1.106.666.667 US$ | - |
| 1987 | 1.346.666.667 US$ | - |
| 1986 | 828.000.000 US$ | - |
| 1985 | 959.190.981 US$ | - |
| 1984 | 1.723.076.923 US$ | - |
| 1983 | 1.746.153.846 US$ | - |
| 1982 | 2.131.681.195 US$ | - |
| 1981 | 2.540.894.387 US$ | - |
| 1980 | 2.080.000.000 US$ | - |
| 1979 | 1.629.436.897 US$ | - |
| 1978 | 1.236.714.092 US$ | - |
| 1977 | 1.246.962.411 US$ | - |
| 1976 | 1.151.062.611 US$ | - |
| 1975 | 1.095.060.313 US$ | - |
| 1974 | 820.505.459 US$ | - |
| 1973 | 523.836.877 US$ | - |
| 1972 | 413.842.620 US$ | - |
| 1971 | 393.164.849 US$ | - |
| 1970 | 344.629.524 US$ | - |
| 1969 | 284.606.549 US$ | - |
| 1968 | 282.596.210 US$ | - |
| 1967 | 249.856.405 US$ | - |
| 1966 | 207.064.906 US$ | - |
| 1965 | 217.690.983 US$ | - |
| 1964 | 248.994.831 US$ | - |
| 1963 | 243.825.388 US$ | - |
| 1962 | 199.885.124 US$ | - |
| 1961 | 175.473.866 US$ | - |
| 1960 | 146.467.548 US$ | - |
Las importaciones de bienes y servicios de Sudán son de 769 millones de US$ (2025), y las de Sudán del Sur, de 3,47 mil millones de US$ (2015). En 2008, las importaciones de Sudán fueron 2,3 veces mayores: 10,7 mil millones de US$ de Sudán y 4,56 mil millones de US$ de Sudán del Sur.
Sudán vs Sudán del Sur: cifras de importaciones
|
Sudán
|
Sudán del Sur
|
|
|---|---|---|
| Importaciones | 769 M US$ (2025) | 3470 M US$ (2015) |
| Puesto mundial | 164/174 | n/d |
| Porcentaje del mundo | 0,002 % | 0,02 % |
| % del PIB | 1,3 % | 28,9 % |
| Mayor categoría de bienes | Maquinaria, electrónica y vehículos (28,6 %, 2018) | Maquinaria, electrónica y vehículos (35,9 %, 2025) |
| Principal origen de bienes | China (17,4 %, 2018) | Uganda (231,8 %, 2025) |
Comparar las importaciones de 2 países cualesquiera
Fuentes:
- Banco Mundial | Economía y crecimiento (1960–2025, actualizado en octubre de 2026)
- TradeMap (2014–2025, actualizado en octubre de 2026)
Creative Commons Atribución (CC BY): puedes copiar, compartir, adaptar y reutilizar este contenido, también con fines comerciales, siempre que cites a statistics.wiki e indiques los cambios que hayas hecho. Las fuentes indicadas arriba pueden tener sus propias condiciones de licencia.