
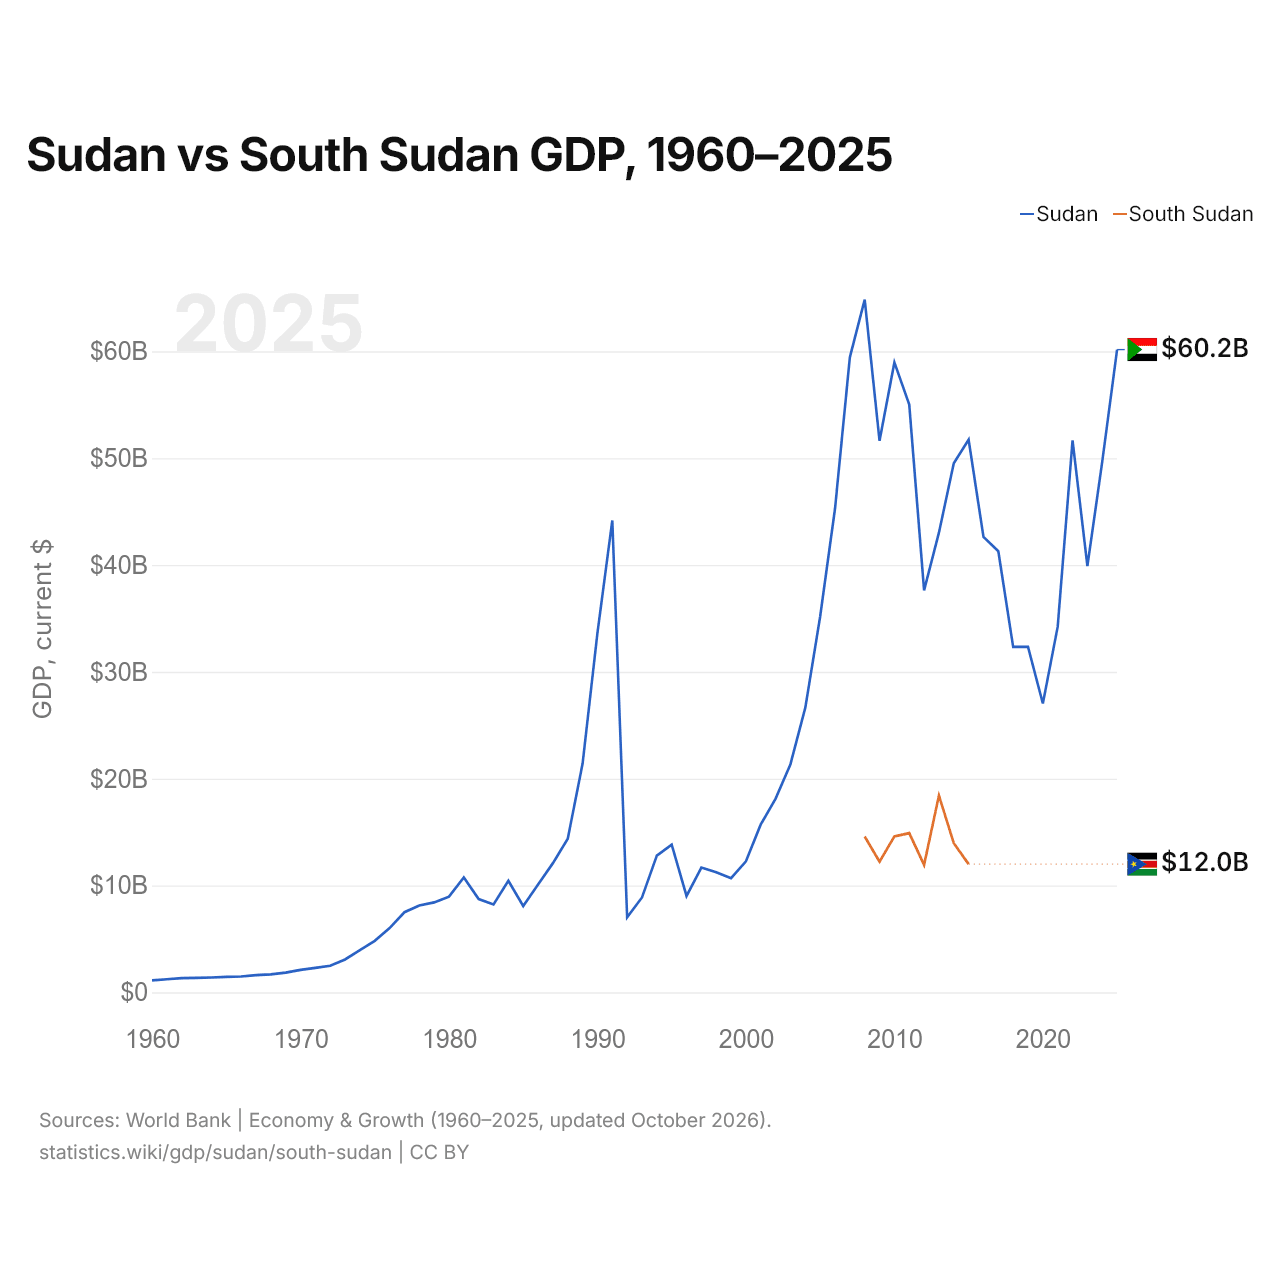
Sudán vs Sudán del Sur: PIB, 1960–2025
1x
| Año | PIB, US$ corrientes | |
|---|---|---|
 Sudán |
 Sudán del Sur |
|
| 2025 | 60.162.634.574 US$ | - |
| 2024 | 49.672.435.513 US$ | - |
| 2023 | 39.898.289.821 US$ | - |
| 2022 | 51.666.875.363 US$ | - |
| 2021 | 34.229.513.775 US$ | - |
| 2020 | 27.034.593.750 US$ | - |
| 2019 | 32.338.079.165 US$ | - |
| 2018 | 32.333.780.383 US$ | - |
| 2017 | 41.283.617.976 US$ | - |
| 2016 | 42.630.376.000 US$ | - |
| 2015 | 51.726.758.677 US$ | 11.997.800.760 US$ |
| 2014 | 49.516.748.618 US$ | 13.962.212.847 US$ |
| 2013 | 43.024.018.082 US$ | 18.426.469.017 US$ |
| 2012 | 37.632.919.967 US$ | 11.931.472.169 US$ |
| 2011 | 55.018.567.211 US$ | 14.907.308.933 US$ |
| 2010 | 58.962.978.034 US$ | 14.602.072.411 US$ |
| 2009 | 51.621.044.077 US$ | 12.231.264.525 US$ |
| 2008 | 64.833.083.257 US$ | 14.586.253.383 US$ |
| 2007 | 59.440.139.775 US$ | - |
| 2006 | 45.263.831.634 US$ | - |
| 2005 | 35.182.711.988 US$ | - |
| 2004 | 26.646.007.251 US$ | - |
| 2003 | 21.355.298.460 US$ | - |
| 2002 | 18.137.128.388 US$ | - |
| 2001 | 15.716.361.792 US$ | - |
| 2000 | 12.257.299.147 US$ | - |
| 1999 | 10.682.028.340 US$ | - |
| 1998 | 11.250.221.537 US$ | - |
| 1997 | 11.681.175.864 US$ | - |
| 1996 | 9.018.300.725 US$ | - |
| 1995 | 13.830.363.900 US$ | - |
| 1994 | 12.793.794.737 US$ | - |
| 1993 | 8.881.005.436 US$ | - |
| 1992 | 7.031.933.492 US$ | - |
| 1991 | 44.171.194.366 US$ | - |
| 1990 | 33.641.222.222 US$ | - |
| 1989 | 21.408.111.111 US$ | - |
| 1988 | 14.372.555.556 US$ | - |
| 1987 | 12.093.333.333 US$ | - |
| 1986 | 10.092.200.000 US$ | - |
| 1985 | 8.075.259.600 US$ | - |
| 1984 | 10.447.615.385 US$ | - |
| 1983 | 8.230.153.846 US$ | - |
| 1982 | 8.732.542.274 US$ | - |
| 1981 | 10.753.888.154 US$ | - |
| 1980 | 8.951.800.000 US$ | - |
| 1979 | 8.418.407.787 US$ | - |
| 1978 | 8.128.719.315 US$ | - |
| 1977 | 7.499.005.639 US$ | - |
| 1976 | 6.013.210.816 US$ | - |
| 1975 | 4.823.090.192 US$ | - |
| 1974 | 3.958.931.660 US$ | - |
| 1973 | 3.077.254.460 US$ | - |
| 1972 | 2.483.055.722 US$ | - |
| 1971 | 2.288.340.041 US$ | - |
| 1970 | 2.100.229.759 US$ | - |
| 1969 | 1.847.501.441 US$ | - |
| 1968 | 1.677.771.401 US$ | - |
| 1967 | 1.607.409.539 US$ | - |
| 1966 | 1.484.491.676 US$ | - |
| 1965 | 1.446.869.619 US$ | - |
| 1964 | 1.388.282.600 US$ | - |
| 1963 | 1.351.234.926 US$ | - |
| 1962 | 1.328.259.625 US$ | - |
| 1961 | 1.222.860.429 US$ | - |
| 1960 | 1.126.364.162 US$ | - |
El PIB de Sudán es de 60,2 mil millones de US$ (2025), y el de Sudán del Sur, de 12 mil millones de US$ (2015).
El PIB per cápita es de 1165 US$ en Sudán (2025) y de 1080 US$ en Sudán del Sur (2015).
Sudán vs Sudán del Sur: últimos datos del PIB
|
Sudán
|
Sudán del Sur
|
|
|---|---|---|
| PIB, US$ corrientes | 60,2 mil M US$ (2025) | 12,0 mil M US$ (2015) |
| Puesto mundial | 91/197 | 151/197 |
| Porcentaje del mundo | 0,05 % | 0,02 % |
| PIB, US$ constantes de 2015 | 30,1 mil M US$ (2025) | 12,0 mil M US$ (2015) |
Comparar el PIB de 2 países cualesquiera
Fuentes:
- Banco Mundial | Economía y crecimiento (1960–2025, actualizado en octubre de 2026)
Creative Commons Atribución (CC BY): puedes copiar, compartir, adaptar y reutilizar este contenido, también con fines comerciales, siempre que cites a statistics.wiki e indiques los cambios que hayas hecho. Las fuentes indicadas arriba pueden tener sus propias condiciones de licencia.