
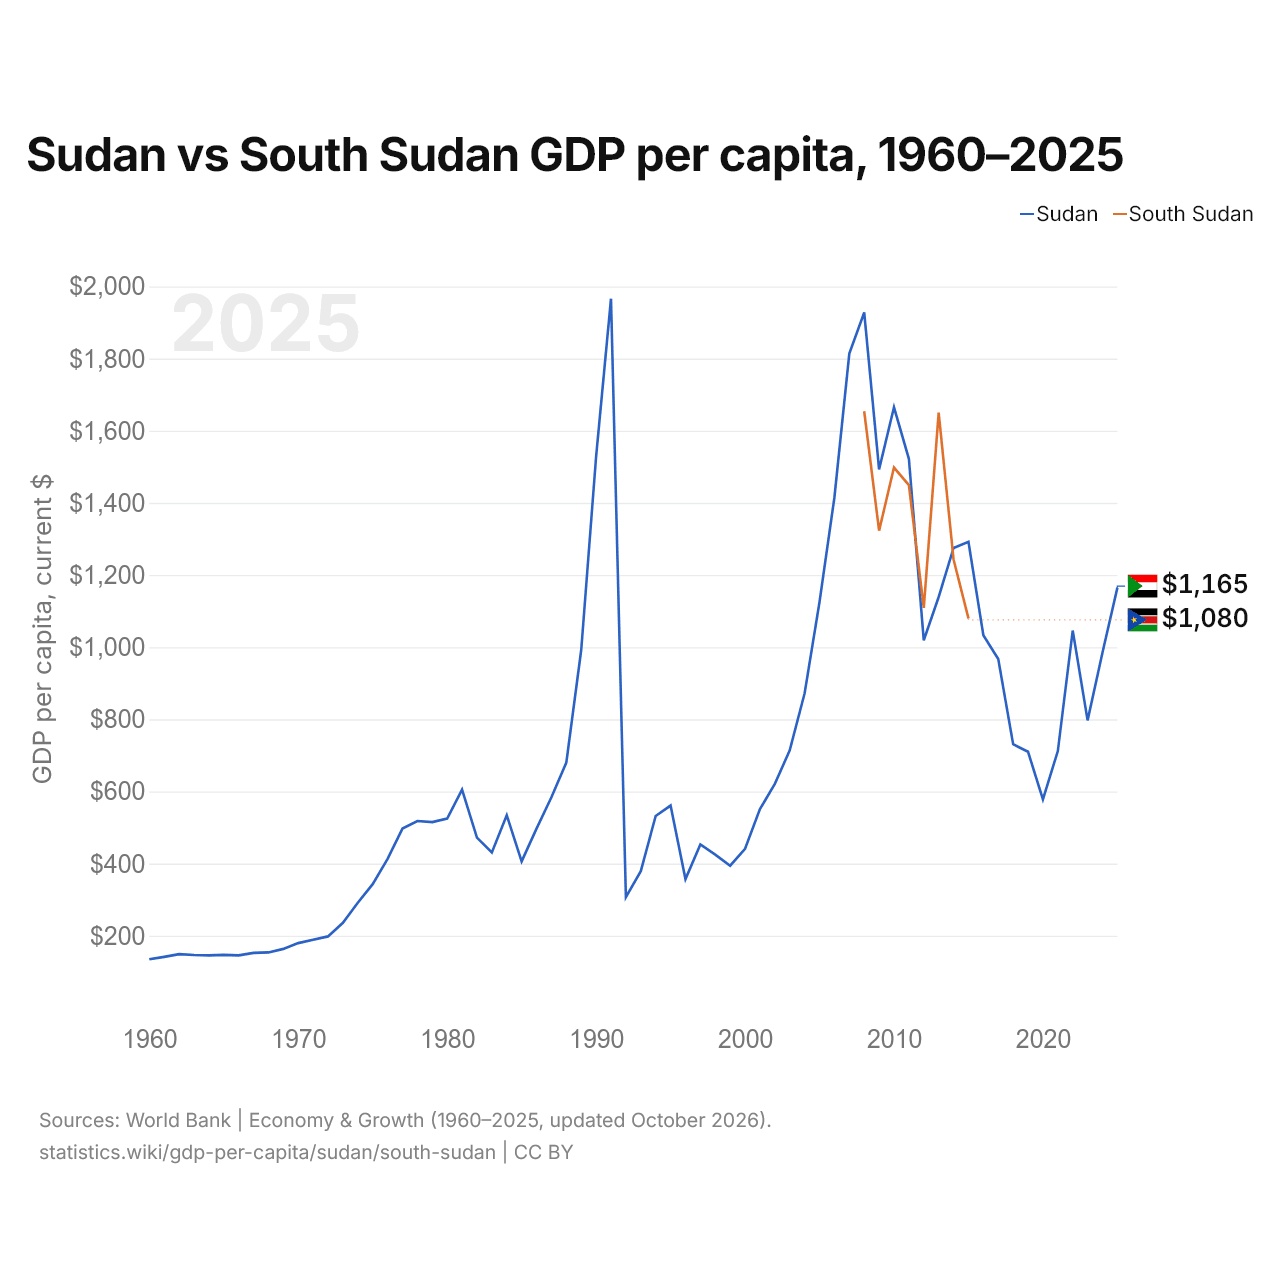
Sudán vs Sudán del Sur: PIB per cápita, 1960–2025
1x
| Año | PIB per cápita, US$ corrientes | |
|---|---|---|
 Sudán |
 Sudán del Sur |
|
| 2025 | 1.165 US$ | - |
| 2024 | 985 US$ | - |
| 2023 | 797 US$ | - |
| 2022 | 1.046 US$ | - |
| 2021 | 712 US$ | - |
| 2020 | 578 US$ | - |
| 2019 | 710 US$ | - |
| 2018 | 731 US$ | - |
| 2017 | 967 US$ | - |
| 2016 | 1.033 US$ | - |
| 2015 | 1.292 US$ | 1.080 US$ |
| 2014 | 1.275 US$ | 1.243 US$ |
| 2013 | 1.139 US$ | 1.650 US$ |
| 2012 | 1.019 US$ | 1.109 US$ |
| 2011 | 1.522 US$ | 1.449 US$ |
| 2010 | 1.665 US$ | 1.498 US$ |
| 2009 | 1.493 US$ | 1.323 US$ |
| 2008 | 1.928 US$ | 1.654 US$ |
| 2007 | 1.814 US$ | - |
| 2006 | 1.415 US$ | - |
| 2005 | 1.125 US$ | - |
| 2004 | 872 US$ | - |
| 2003 | 714 US$ | - |
| 2002 | 621 US$ | - |
| 2001 | 551 US$ | - |
| 2000 | 441 US$ | - |
| 1999 | 394 US$ | - |
| 1998 | 425 US$ | - |
| 1997 | 453 US$ | - |
| 1996 | 357 US$ | - |
| 1995 | 561 US$ | - |
| 1994 | 532 US$ | - |
| 1993 | 379 US$ | - |
| 1992 | 307 US$ | - |
| 1991 | 1.966 US$ | - |
| 1990 | 1.528 US$ | - |
| 1989 | 992 US$ | - |
| 1988 | 680 US$ | - |
| 1987 | 584 US$ | - |
| 1986 | 497 US$ | - |
| 1985 | 406 US$ | - |
| 1984 | 534 US$ | - |
| 1983 | 431 US$ | - |
| 1982 | 472 US$ | - |
| 1981 | 605 US$ | - |
| 1980 | 525 US$ | - |
| 1979 | 515 US$ | - |
| 1978 | 518 US$ | - |
| 1977 | 497 US$ | - |
| 1976 | 413 US$ | - |
| 1975 | 343 US$ | - |
| 1974 | 291,5 US$ | - |
| 1973 | 235,8 US$ | - |
| 1972 | 198,2 US$ | - |
| 1971 | 189 US$ | - |
| 1970 | 179,6 US$ | - |
| 1969 | 163,5 US$ | - |
| 1968 | 153,7 US$ | - |
| 1967 | 152,4 US$ | - |
| 1966 | 145,6 US$ | - |
| 1965 | 146,8 US$ | - |
| 1964 | 145,7 US$ | - |
| 1963 | 146,6 US$ | - |
| 1962 | 148,9 US$ | - |
| 1961 | 141,6 US$ | - |
| 1960 | 134,7 US$ | - |
El PIB per cápita es de 1165 US$ en Sudán (2025) y de 1080 US$ en Sudán del Sur (2015). En 2008 era de 1928 US$ en Sudán y de 1654 US$ en Sudán del Sur, un 17 % más alto en Sudán.
Sudán vs Sudán del Sur: últimos datos del PIB per cápita
|
Sudán
|
Sudán del Sur
|
|
|---|---|---|
| PIB per cápita, US$ corrientes | 1165 US$ (2025) | 1080 US$ (2015) |
| Puesto mundial | 175/197 | 180/197 |
| PIB per cápita, US$ constantes de 2015 | 582 US$ (2025) | 1080 US$ (2015) |
| × media mundial | 0,08× | 0,11× |
Comparar el PIB per cápita de 2 países cualesquiera
Fuentes:
- Banco Mundial | Economía y crecimiento (1960–2025, actualizado en octubre de 2026)
Creative Commons Atribución (CC BY): puedes copiar, compartir, adaptar y reutilizar este contenido, también con fines comerciales, siempre que cites a statistics.wiki e indiques los cambios que hayas hecho. Las fuentes indicadas arriba pueden tener sus propias condiciones de licencia.