
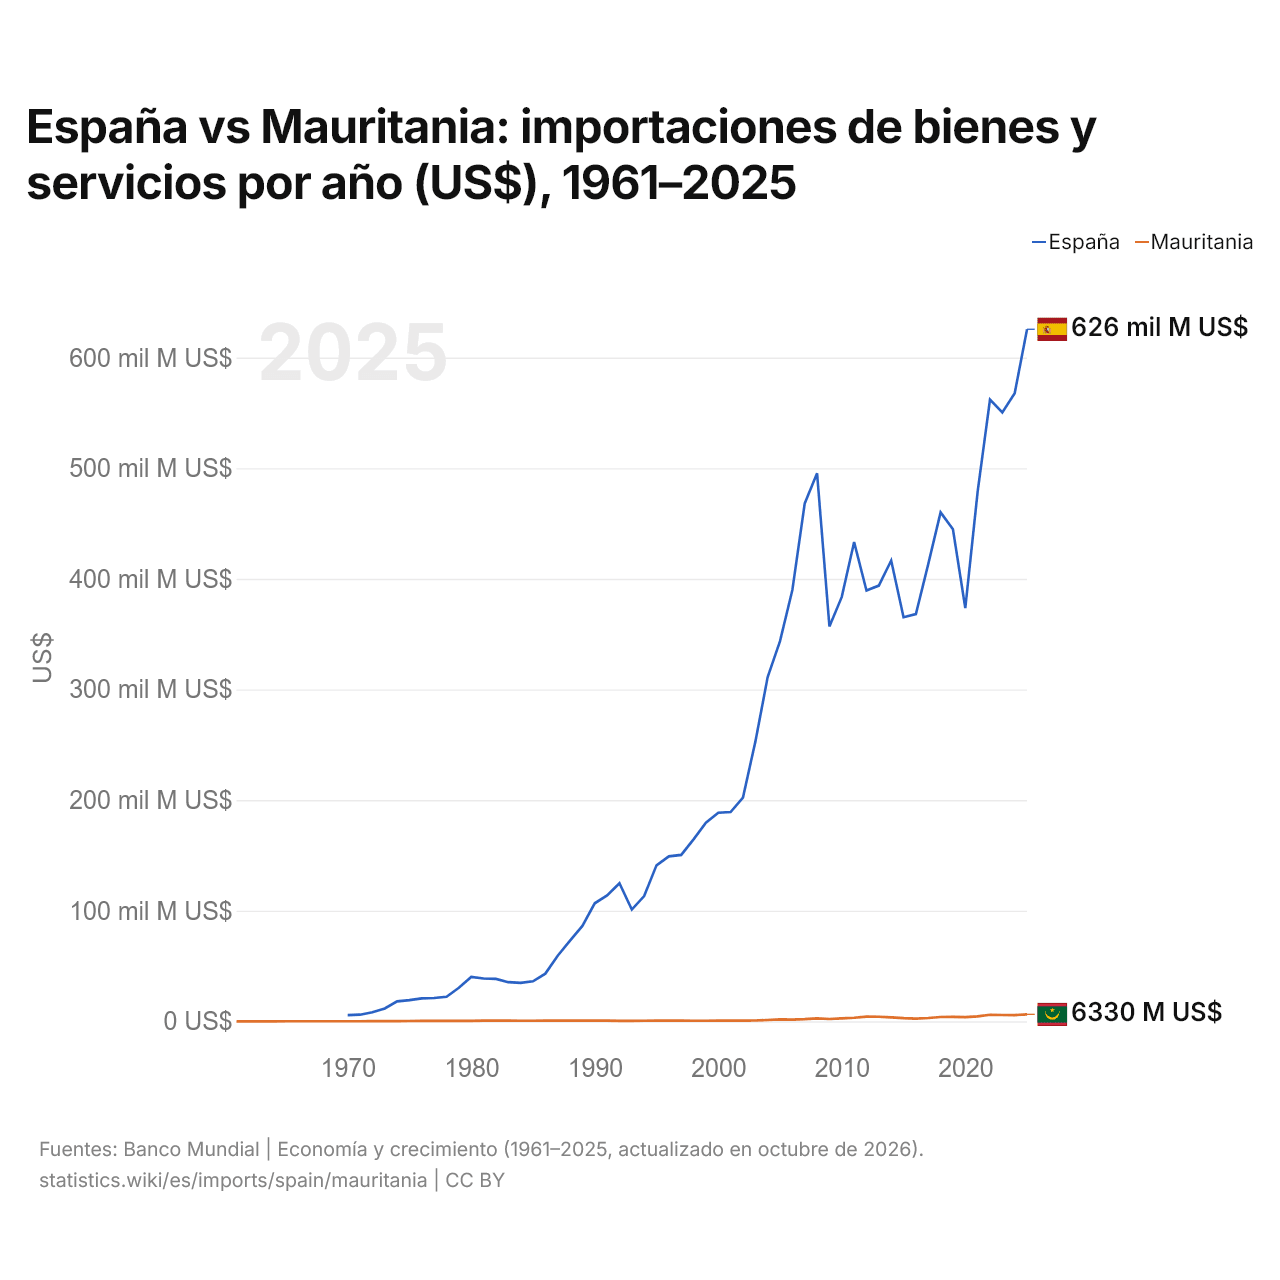
España vs Mauritania: importaciones de bienes y servicios por año (US$), 1961–2025
| Año | US$ | |
|---|---|---|
 España |
 Mauritania |
|
| 2025 | 625.571.094.599 US$ | 6.327.162.514 US$ |
| 2024 | 567.649.024.934 US$ | 5.677.643.653 US$ |
| 2023 | 550.315.993.016 US$ | 5.745.446.437 US$ |
| 2022 | 562.067.869.749 US$ | 5.956.297.149 US$ |
| 2021 | 478.813.490.690 US$ | 4.467.674.565 US$ |
| 2020 | 373.587.218.923 US$ | 3.747.824.684 US$ |
| 2019 | 444.777.298.016 US$ | 4.033.369.861 US$ |
| 2018 | 460.052.638.839 US$ | 3.929.143.535 US$ |
| 2017 | 413.273.524.151 US$ | 3.018.559.264 US$ |
| 2016 | 368.077.385.210 US$ | 2.513.699.049 US$ |
| 2015 | 365.267.176.774 US$ | 2.915.057.681 US$ |
| 2014 | 416.556.734.925 US$ | 3.586.992.625 US$ |
| 2013 | 393.853.404.529 US$ | 4.110.638.554 US$ |
| 2012 | 389.373.194.053 US$ | 4.206.931.498 US$ |
| 2011 | 433.230.760.963 US$ | 3.267.485.663 US$ |
| 2010 | 383.637.214.717 US$ | 2.683.928.047 US$ |
| 2009 | 356.955.506.971 US$ | 2.110.388.243 US$ |
| 2008 | 495.421.038.137 US$ | 2.734.283.391 US$ |
| 2007 | 468.185.448.713 US$ | 1.979.303.956 US$ |
| 2006 | 389.916.169.856 US$ | 1.584.465.517 US$ |
| 2005 | 343.612.756.868 US$ | 1.805.119.194 US$ |
| 2004 | 311.226.847.419 US$ | 1.227.308.582 US$ |
| 2003 | 252.597.164.852 US$ | 742.377.025 US$ |
| 2002 | 202.315.899.880 US$ | 568.870.241 US$ |
| 2001 | 189.199.946.438 US$ | 613.989.585 US$ |
| 2000 | 188.597.988.060 US$ | 594.773.876 US$ |
| 1999 | 179.579.068.361 US$ | 525.231.931 US$ |
| 1998 | 164.461.521.328 US$ | 547.348.702 US$ |
| 1997 | 150.448.863.636 US$ | 608.286.588 US$ |
| 1996 | 149.160.646.263 US$ | 667.182.822 US$ |
| 1995 | 141.040.832.666 US$ | 667.898.123 US$ |
| 1994 | 113.185.677.556 US$ | 544.298.175 US$ |
| 1993 | 101.028.880.899 US$ | 382.686.043 US$ |
| 1992 | 124.858.948.480 US$ | 431.906.454 US$ |
| 1991 | 113.803.519.616 US$ | 603.327.625 US$ |
| 1990 | 106.698.684.296 US$ | 632.068.929 US$ |
| 1989 | 86.193.191.848 US$ | 568.480.363 US$ |
| 1988 | 73.014.657.906 US$ | 615.941.855 US$ |
| 1987 | 59.270.990.433 US$ | 618.370.339 US$ |
| 1986 | 43.101.197.576 US$ | 650.009.597 US$ |
| 1985 | 36.161.758.317 US$ | 563.391.028 US$ |
| 1984 | 34.830.495.757 US$ | 542.696.591 US$ |
| 1983 | 35.374.945.476 US$ | 614.032.310 US$ |
| 1982 | 38.319.582.008 US$ | 648.640.501 US$ |
| 1981 | 38.729.324.203 US$ | 572.218.353 US$ |
| 1980 | 40.198.018.102 US$ | 482.428.348 US$ |
| 1979 | 30.326.926.128 US$ | 393.063.713 US$ |
| 1978 | 22.235.898.438 US$ | 360.360.616 US$ |
| 1977 | 21.074.790.800 US$ | 406.019.479 US$ |
| 1976 | 20.751.158.916 US$ | 416.962.601 US$ |
| 1975 | 19.179.240.580 US$ | 293.406.802 US$ |
| 1974 | 18.006.071.532 US$ | 251.014.222 US$ |
| 1973 | 11.627.215.877 US$ | 157.860.291 US$ |
| 1972 | 8.184.827.854 US$ | 133.106.293 US$ |
| 1971 | 6.004.950.898 US$ | 57.029.505 US$ |
| 1970 | 5.612.265.272 US$ | 53.340.246 US$ |
| 1969 | - | 47.902.224 US$ |
| 1968 | - | 47.194.756 US$ |
| 1967 | - | 45.475.865 US$ |
| 1966 | - | 38.755.999 US$ |
| 1965 | - | 38.130.099 US$ |
| 1964 | - | 35.079.689 US$ |
| 1963 | - | 34.317.089 US$ |
| 1962 | - | 35.270.342 US$ |
| 1961 | - | 29.741.476 US$ |
En 2025, las importaciones de bienes y servicios de España fueron de 626 mil millones de US$ y las de Mauritania, de 6,33 mil millones de US$: las de España fueron 99 veces mayores. En 1970, las importaciones de España fueron 110 veces mayores: 5,61 mil millones de US$ de España y 53,3 millones de US$ de Mauritania.
Las importaciones de bienes y servicios de España han sido mayores que las de Mauritania todos los años desde 1970.
España vs Mauritania: cifras de importaciones
|
España
|
Mauritania
|
|
|---|---|---|
| Importaciones | 626 mil M US$ (2025) | 6330 M US$ (2025) |
| Puesto mundial | 16/174 | 134/174 |
| Porcentaje del mundo | 1,85 % | 0,02 % |
| % del PIB | 32,8 % | 54,2 % |
| Mayor categoría de bienes | Maquinaria, electrónica y vehículos (32,8 %, 2025) | Maquinaria, electrónica y vehículos (33,8 %, 2025) |
| Principal origen de bienes | China (11,1 %, 2025) | España (13 %, 2025) |
Comparar las importaciones de 2 países cualesquiera
Fuentes:
- Banco Mundial | Economía y crecimiento (1961–2025, actualizado en octubre de 2026)
- TradeMap (2001–2025, actualizado en octubre de 2026)
Creative Commons Atribución (CC BY): puedes copiar, compartir, adaptar y reutilizar este contenido, también con fines comerciales, siempre que cites a statistics.wiki e indiques los cambios que hayas hecho. Las fuentes indicadas arriba pueden tener sus propias condiciones de licencia.