
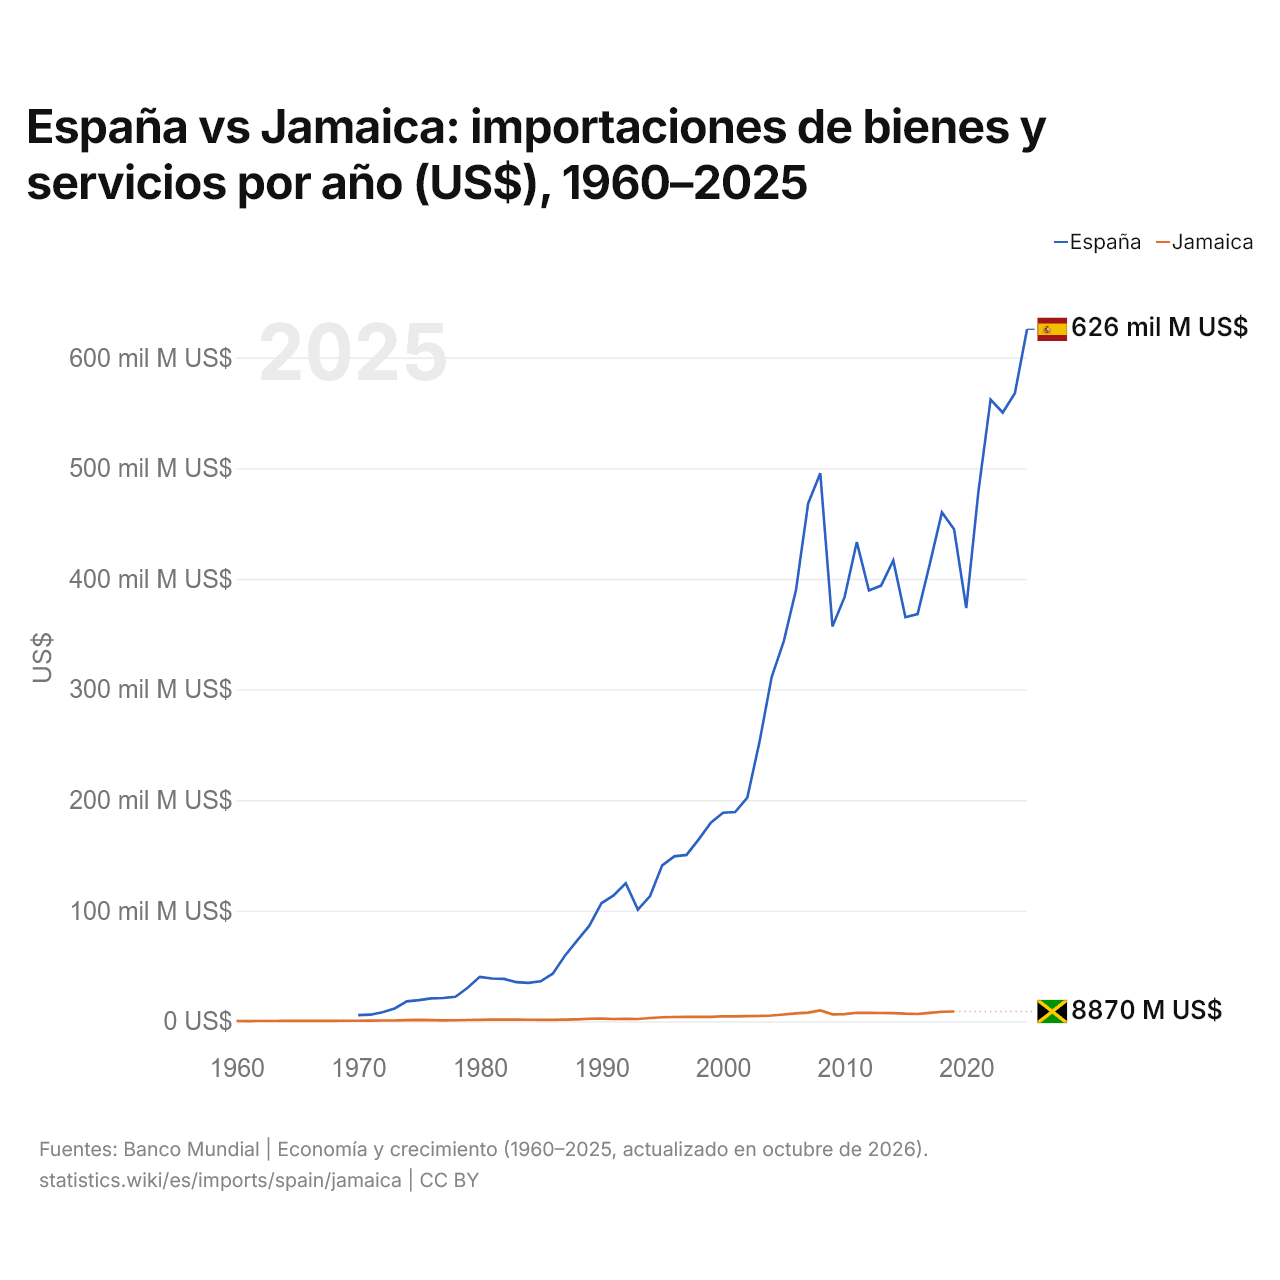
España vs Jamaica: importaciones de bienes y servicios por año (US$), 1960–2025
1x
| Año | US$ | |
|---|---|---|
 España |
 Jamaica |
|
| 2025 | 625.571.094.599 US$ | - |
| 2024 | 567.649.024.934 US$ | - |
| 2023 | 550.315.993.016 US$ | - |
| 2022 | 562.067.869.749 US$ | - |
| 2021 | 478.813.490.690 US$ | - |
| 2020 | 373.587.218.923 US$ | - |
| 2019 | 444.777.298.016 US$ | 8.866.349.165 US$ |
| 2018 | 460.052.638.839 US$ | 8.666.069.763 US$ |
| 2017 | 413.273.524.151 US$ | 7.712.823.138 US$ |
| 2016 | 368.077.385.210 US$ | 6.651.173.740 US$ |
| 2015 | 365.267.176.774 US$ | 6.912.558.477 US$ |
| 2014 | 416.556.734.925 US$ | 7.434.187.504 US$ |
| 2013 | 393.853.404.529 US$ | 7.514.909.453 US$ |
| 2012 | 389.373.194.053 US$ | 7.678.417.130 US$ |
| 2011 | 433.230.760.963 US$ | 7.721.134.727 US$ |
| 2010 | 383.637.214.717 US$ | 6.555.427.347 US$ |
| 2009 | 356.955.506.971 US$ | 6.351.790.086 US$ |
| 2008 | 495.421.038.137 US$ | 9.820.605.949 US$ |
| 2007 | 468.185.448.713 US$ | 7.873.767.552 US$ |
| 2006 | 389.916.169.856 US$ | 7.231.367.529 US$ |
| 2005 | 343.612.756.868 US$ | 6.208.262.060 US$ |
| 2004 | 311.226.847.419 US$ | 5.267.839.051 US$ |
| 2003 | 252.597.164.852 US$ | 4.860.075.377 US$ |
| 2002 | 202.315.899.880 US$ | 4.770.556.772 US$ |
| 2001 | 189.199.946.438 US$ | 4.529.651.874 US$ |
| 2000 | 188.597.988.060 US$ | 4.567.635.283 US$ |
| 1999 | 179.579.068.361 US$ | 4.016.518.287 US$ |
| 1998 | 164.461.521.328 US$ | 4.045.800.274 US$ |
| 1997 | 150.448.863.636 US$ | 4.065.249.732 US$ |
| 1996 | 149.160.646.263 US$ | 3.879.895.337 US$ |
| 1995 | 141.040.832.666 US$ | 3.708.143.138 US$ |
| 1994 | 113.185.677.556 US$ | 3.045.100.768 US$ |
| 1993 | 101.028.880.899 US$ | 2.108.459.209 US$ |
| 1992 | 124.858.948.480 US$ | 2.235.110.186 US$ |
| 1991 | 113.803.519.616 US$ | 2.110.239.657 US$ |
| 1990 | 106.698.684.296 US$ | 2.382.299.630 US$ |
| 1989 | 86.193.191.848 US$ | 2.308.098.660 US$ |
| 1988 | 73.014.657.906 US$ | 1.829.425.309 US$ |
| 1987 | 59.270.990.433 US$ | 1.520.814.039 US$ |
| 1986 | 43.101.197.576 US$ | 1.263.966.992 US$ |
| 1985 | 36.161.758.317 US$ | 1.379.728.376 US$ |
| 1984 | 34.830.495.757 US$ | 1.462.360.264 US$ |
| 1983 | 35.374.945.476 US$ | 1.557.278.453 US$ |
| 1982 | 38.319.582.008 US$ | 1.602.036.578 US$ |
| 1981 | 38.729.324.203 US$ | 1.662.493.965 US$ |
| 1980 | 40.198.018.102 US$ | 1.367.560.654 US$ |
| 1979 | 30.326.926.128 US$ | 1.227.859.821 US$ |
| 1978 | 22.235.898.438 US$ | 987.222.432 US$ |
| 1977 | 21.074.790.800 US$ | 922.350.922 US$ |
| 1976 | 20.751.158.916 US$ | 1.123.871.124 US$ |
| 1975 | 19.179.240.580 US$ | 1.304.711.305 US$ |
| 1974 | 18.006.071.532 US$ | 1.090.321.090 US$ |
| 1973 | 11.627.215.877 US$ | 783.909.574 US$ |
| 1972 | 8.184.827.854 US$ | 770.072.707 US$ |
| 1971 | 6.004.950.898 US$ | 630.401.944 US$ |
| 1970 | 5.612.265.272 US$ | 525.600.210 US$ |
| 1969 | - | 517.679.586 US$ |
| 1968 | - | 455.999.635 US$ |
| 1967 | - | 422.531.127 US$ |
| 1966 | - | 393.399.843 US$ |
| 1965 | - | 358.399.857 US$ |
| 1964 | - | 349.999.860 US$ |
| 1963 | - | 281.399.887 US$ |
| 1962 | - | 271.599.891 US$ |
| 1961 | - | 261.799.895 US$ |
| 1960 | - | 265.999.894 US$ |
Las importaciones de bienes y servicios de España son de 626 mil millones de US$ (2025), y las de Jamaica, de 8,87 mil millones de US$ (2019). En 1970, las importaciones de España fueron 11 veces mayores: 5,61 mil millones de US$ de España y 526 millones de US$ de Jamaica.
Las importaciones de bienes y servicios de España han sido mayores que las de Jamaica todos los años desde 1970.
España vs Jamaica: cifras de importaciones
|
España
|
Jamaica
|
|
|---|---|---|
| Importaciones | 626 mil M US$ (2025) | 8870 M US$ (2019) |
| Puesto mundial | 16/174 | n/d |
| Porcentaje del mundo | 1,85 % | 0,04 % |
| % del PIB | 32,8 % | 52,1 % |
| Mayor categoría de bienes | Maquinaria, electrónica y vehículos (32,8 %, 2025) | Petróleo, gas, minerales y otras materias primas (26,9 %, 2025) |
| Principal origen de bienes | China (11,1 %, 2025) | Estados Unidos (37,9 %, 2025) |
Comparar las importaciones de 2 países cualesquiera
Fuentes:
- Banco Mundial | Economía y crecimiento (1960–2025, actualizado en octubre de 2026)
- TradeMap (2001–2025, actualizado en octubre de 2026)
Creative Commons Atribución (CC BY): puedes copiar, compartir, adaptar y reutilizar este contenido, también con fines comerciales, siempre que cites a statistics.wiki e indiques los cambios que hayas hecho. Las fuentes indicadas arriba pueden tener sus propias condiciones de licencia.