
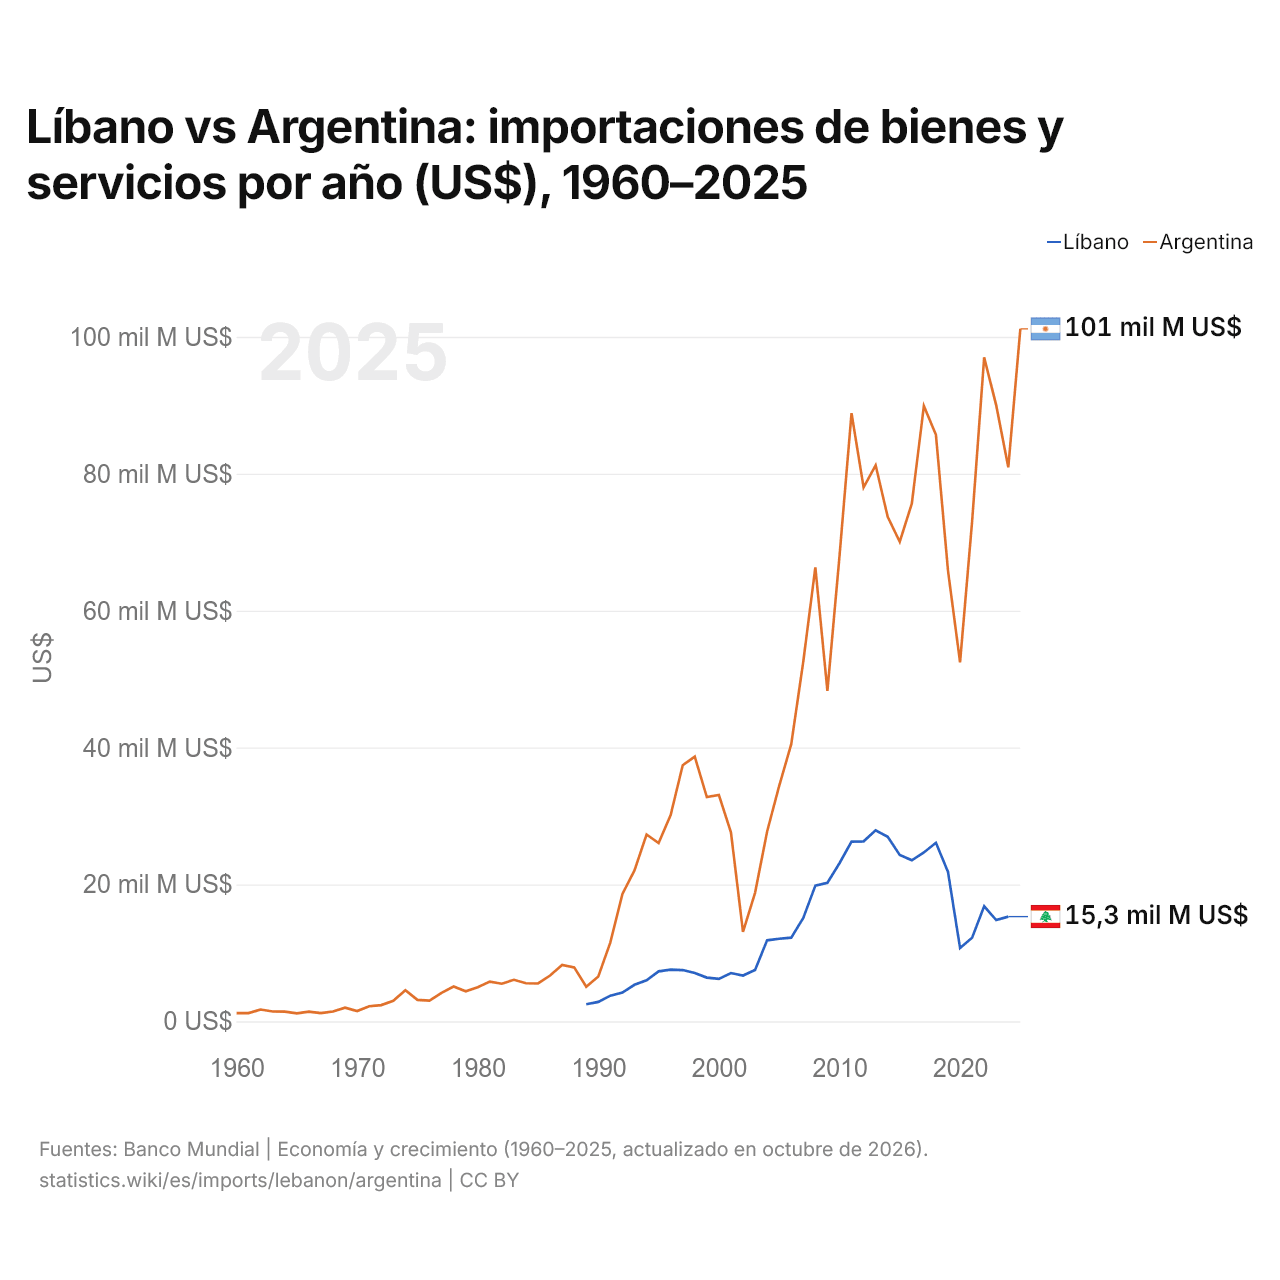
Líbano vs Argentina: importaciones de bienes y servicios por año (US$), 1960–2025
| Año | US$ | |
|---|---|---|
 Líbano |
 Argentina |
|
| 2025 | - | 101.159.779.351 US$ |
| 2024 | 15.301.404.346 US$ | 80.944.817.978 US$ |
| 2023 | 14.788.907.443 US$ | 89.980.573.298 US$ |
| 2022 | 16.806.427.844 US$ | 96.991.607.941 US$ |
| 2021 | 12.214.357.414 US$ | 73.042.905.138 US$ |
| 2020 | 10.705.132.083 US$ | 52.454.091.268 US$ |
| 2019 | 21.820.628.748 US$ | 65.845.624.691 US$ |
| 2018 | 26.079.751.235 US$ | 85.681.309.473 US$ |
| 2017 | 24.672.982.326 US$ | 89.910.495.567 US$ |
| 2016 | 23.526.463.868 US$ | 75.639.254.068 US$ |
| 2015 | 24.315.275.422 US$ | 70.064.879.912 US$ |
| 2014 | 26.962.653.976 US$ | 73.691.675.720 US$ |
| 2013 | 27.906.587.980 US$ | 81.240.190.817 US$ |
| 2012 | 26.294.002.587 US$ | 78.013.690.407 US$ |
| 2011 | 26.262.779.873 US$ | 88.838.309.449 US$ |
| 2010 | 23.094.612.059 US$ | 67.937.933.972 US$ |
| 2009 | 20.249.317.982 US$ | 48.268.743.530 US$ |
| 2008 | 19.824.163.540 US$ | 66.316.154.417 US$ |
| 2007 | 15.101.534.372 US$ | 52.567.536.062 US$ |
| 2006 | 12.218.142.062 US$ | 40.480.743.016 US$ |
| 2005 | 12.068.415.010 US$ | 34.392.237.787 US$ |
| 2004 | 11.832.129.865 US$ | 27.736.672.324 US$ |
| 2003 | 7.501.824.212 US$ | 18.772.898.619 US$ |
| 2002 | 6.692.537.313 US$ | 13.065.823.829 US$ |
| 2001 | 7.051.409.619 US$ | 27.603.881.800 US$ |
| 2000 | 6.202.985.075 US$ | 33.070.146.000 US$ |
| 1999 | 6.391.244.718 US$ | 32.762.700.000 US$ |
| 1998 | 7.063.369.153 US$ | 38.667.300.000 US$ |
| 1997 | 7.490.743.748 US$ | 37.413.700.000 US$ |
| 1996 | 7.563.885.156 US$ | 30.148.400.000 US$ |
| 1995 | 7.304.200.110 US$ | 26.038.017.000 US$ |
| 1994 | 5.989.999.913 US$ | 27.299.960.000 US$ |
| 1993 | 5.334.999.955 US$ | 22.049.649.650 US$ |
| 1992 | 4.207.000.160 US$ | 18.606.116.034 US$ |
| 1991 | 3.748.853.489 US$ | 11.531.201.154 US$ |
| 1990 | 2.836.016.496 US$ | 6.546.497.152 US$ |
| 1989 | 2.489.030.212 US$ | 5.041.767.786 US$ |
| 1988 | - | 7.882.225.528 US$ |
| 1987 | - | 8.243.255.952 US$ |
| 1986 | - | 6.695.427.336 US$ |
| 1985 | - | 5.529.993.736 US$ |
| 1984 | - | 5.561.048.223 US$ |
| 1983 | - | 6.068.376.037 US$ |
| 1982 | - | 5.497.685.333 US$ |
| 1981 | - | 5.800.000.171 US$ |
| 1980 | - | 4.989.980.080 US$ |
| 1979 | - | 4.383.512.571 US$ |
| 1978 | - | 5.089.538.172 US$ |
| 1977 | - | 4.159.999.873 US$ |
| 1976 | - | 3.030.000.057 US$ |
| 1975 | - | 3.135.135.021 US$ |
| 1974 | - | 4.555.555.490 US$ |
| 1973 | - | 3.000.000.102 US$ |
| 1972 | - | 2.374.999.979 US$ |
| 1971 | - | 2.199.999.959 US$ |
| 1970 | - | 1.495.789.482 US$ |
| 1969 | - | 2.000.000.041 US$ |
| 1968 | - | 1.428.571.475 US$ |
| 1967 | - | 1.212.121.237 US$ |
| 1966 | - | 1.428.571.371 US$ |
| 1965 | - | 1.176.470.539 US$ |
| 1964 | - | 1.424.602.864 US$ |
| 1963 | - | 1.441.753.153 US$ |
| 1962 | - | 1.720.750.787 US$ |
| 1961 | - | 1.206.915.602 US$ |
| 1960 | - | 1.206.418.120 US$ |
Las importaciones de bienes y servicios de Líbano fueron de 15,3 mil millones de US$ (2024) y las de Argentina, de 80,9 mil millones de US$ (2024): las de Argentina fueron 5,3 veces mayores. En 1989, las importaciones de Argentina fueron 2,0 veces mayores: 2,49 mil millones de US$ de Líbano y 5,04 mil millones de US$ de Argentina.
Las importaciones de bienes y servicios de Argentina han sido mayores que las de Líbano todos los años desde 1989.
Líbano vs Argentina: cifras de importaciones
|
Líbano
|
Argentina
|
|
|---|---|---|
| Importaciones | 15,3 mil M US$ (2024) | 101 mil M US$ (2025) |
| Puesto mundial | 103/174 | 49/174 |
| Porcentaje del mundo | 0,05 % | 0,3 % |
| % del PIB | 58,9 % | 14,8 % |
| Mayor categoría de bienes | Petróleo, gas, minerales y otras materias primas (27,8 %, 2024) | Maquinaria, electrónica y vehículos (49,9 %, 2025) |
| Principal origen de bienes | China (11,4 %, 2024) | Brasil (24,5 %, 2025) |
Comparar las importaciones de 2 países cualesquiera
Fuentes:
- Banco Mundial | Economía y crecimiento (1960–2025, actualizado en octubre de 2026)
- TradeMap (2001–2025, actualizado en octubre de 2026)
Creative Commons Atribución (CC BY): puedes copiar, compartir, adaptar y reutilizar este contenido, también con fines comerciales, siempre que cites a statistics.wiki e indiques los cambios que hayas hecho. Las fuentes indicadas arriba pueden tener sus propias condiciones de licencia.