
Importaciones de bienes y servicios de Siria por año (US$)
| Año | US$ | Puesto mundial |
|---|---|---|
| Importaciones | Puesto mundial | |
| 2022 | 6.803.218.572 US$ | #131 |
| 2021 | 6.560.493.570 US$ | #125 |
| 2020 | 3.750.745.660 US$ | #134 |
| 2019 | 6.546.690.317 US$ | #122 |
| 2018 | 7.683.752.902 US$ | #115 |
| 2017 | 6.828.054.268 US$ | #116 |
| 2016 | 5.723.436.973 US$ | #121 |
| 2015 | 6.058.999.272 US$ | #122 |
| 2014 | 10.159.432.249 US$ | #103 |
| 2013 | 7.888.121.085 US$ | #110 |
| 2012 | 11.943.881.866 US$ | #97 |
| 2011 | 21.157.918.970 US$ | #75 |
| 2010 | 19.548.915.139 US$ | #74 |
| 2009 | 16.712.093.143 US$ | #75 |
| 2008 | 19.270.827.060 US$ | #75 |
| 2007 | 15.289.807.769 US$ | #76 |
| 2006 | 11.878.533.724 US$ | #79 |
| 2005 | 11.281.149.425 US$ | #75 |
| 2004 | 9.449.227.723 US$ | #75 |
| 2003 | 6.404.206.462 US$ | #81 |
| 2002 | 6.591.622.611 US$ | #77 |
| 2001 | 6.168.564.305 US$ | #74 |
| 2000 | 5.523.717.815 US$ | #72 |
| 1999 | 5.078.313.953 US$ | #73 |
| 1998 | 4.696.403.846 US$ | #80 |
| 1997 | 4.903.093.385 US$ | #75 |
| 1996 | 5.252.195.609 US$ | #70 |
| 1995 | 4.323.552.894 US$ | #75 |
| 1994 | 4.594.640.000 US$ | #68 |
| 1993 | 5.602.184.892 US$ | #61 |
| 1992 | 4.987.517.654 US$ | #62 |
| 1991 | 4.163.791.667 US$ | #64 |
| 1990 | 3.440.367.130 US$ | #67 |
| 1989 | 2.965.896.087 US$ | #60 |
| 1988 | 2.749.847.766 US$ | #61 |
| 1987 | 3.286.057.265 US$ | #56 |
| 1986 | 2.957.326.806 US$ | #57 |
| 1985 | 4.173.565.121 US$ | #51 |
| 1984 | 4.200.952.492 US$ | #50 |
| 1983 | 4.691.609.868 US$ | #49 |
| 1982 | 4.063.358.923 US$ | #52 |
| 1981 | 5.116.427.206 US$ | #50 |
| 1980 | 4.628.789.809 US$ | #50 |
| 1979 | 3.575.286.624 US$ | #49 |
| 1978 | 2.896.334.479 US$ | #50 |
| 1977 | 3.129.344.729 US$ | #46 |
| 1976 | 2.617.783.266 US$ | #47 |
| 1975 | 2.318.859.794 US$ | #48 |
| 1974 | 1.741.126.669 US$ | #50 |
| 1973 | 834.756.899 US$ | #52 |
| 1972 | 725.132.626 US$ | #53 |
| 1971 | 578.539.108 US$ | #55 |
| 1970 | 450.739.692 US$ | #56 |
| 1969 | 486.948.413 US$ | - |
| 1968 | 359.837.643 US$ | - |
| 1967 | 302.663.381 US$ | - |
| 1966 | 308.588.670 US$ | - |
| 1965 | 250.835.033 US$ | - |
| 1964 | 257.291.283 US$ | - |
| 1963 | 254.143.979 US$ | - |
| 1962 | 239.475.799 US$ | - |
| 1961 | 211.572.011 US$ | - |
| 1960 | 238.438.296 US$ | - |
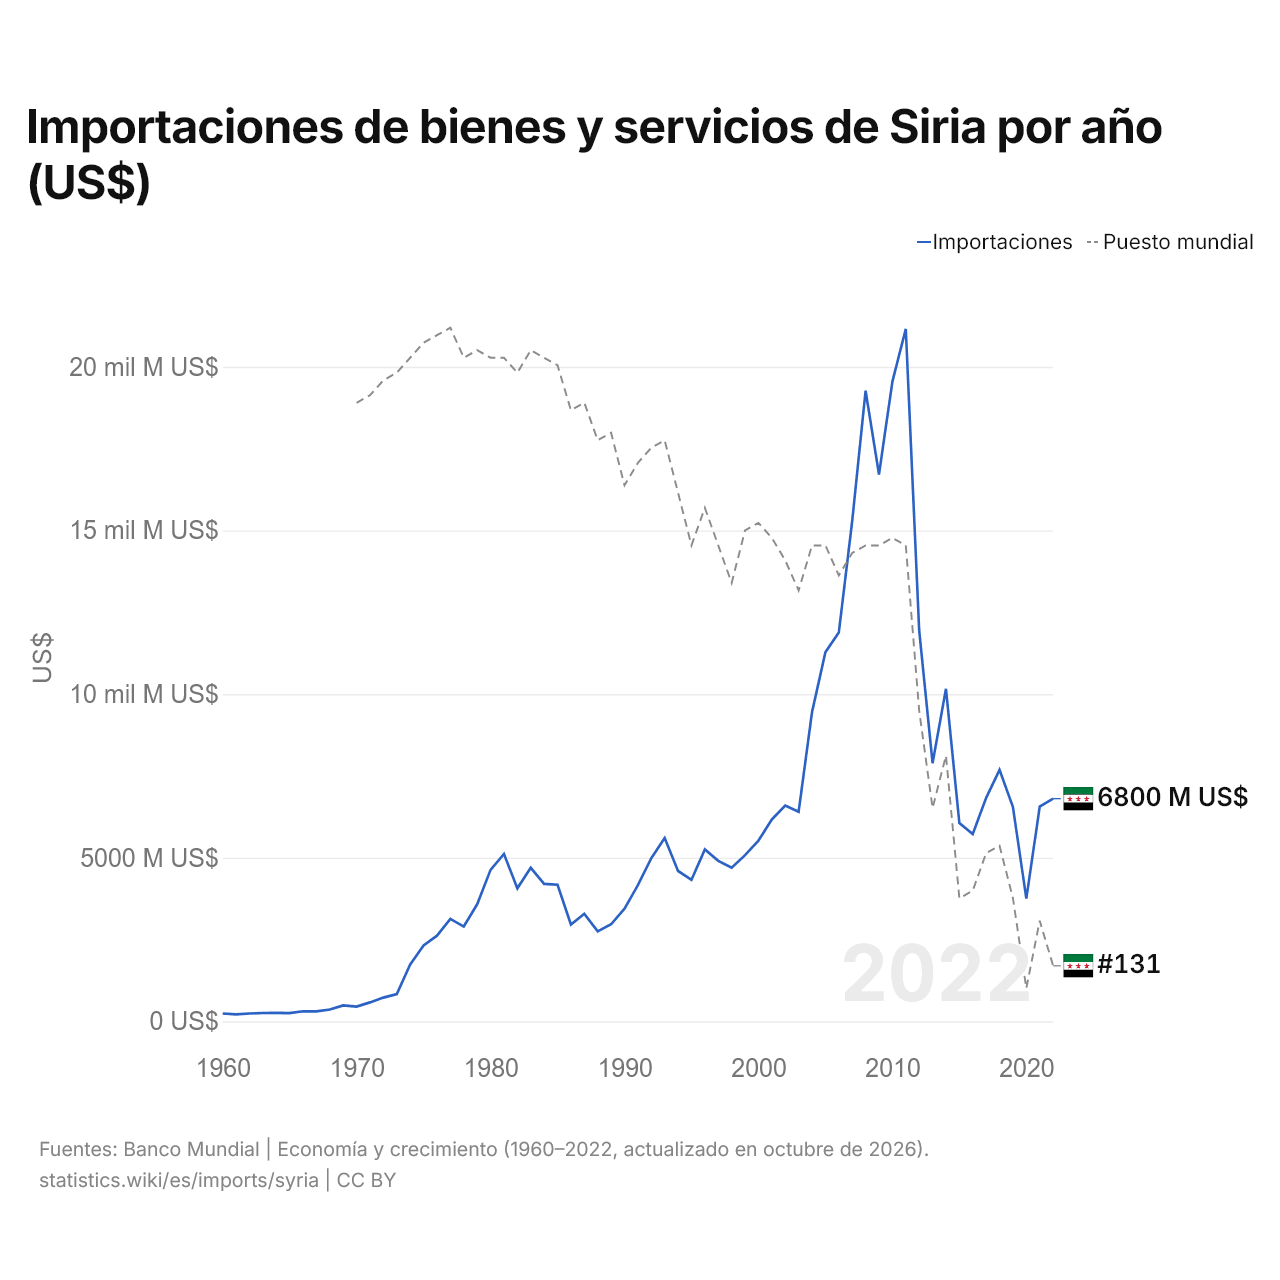
Las importaciones de bienes y servicios de Siria son de 6,8 mil millones de US$ (2022), frente a 238 millones de US$ en 1960. Su máximo fue de 21,2 mil millones de US$, en 2011. Ocupan el puesto 131 del mundo; el año anterior, el 125. Su mejor posición fue el puesto 46, por última vez en 1977.
Las importaciones de bienes y servicios de Siria ocupan el 41.º puesto entre 44 países de Asia. Las importaciones de Siria superan a sus exportaciones en 5,19 mil millones de US$, un déficit comercial (2022). El comercio de Siria, sus exportaciones e importaciones juntas, equivale al 35,4 % de su PIB (2022), el puesto 158 del mundo.
Importaciones de bienes y de servicios de Siria (US$)
| Año | US$ | |
|---|---|---|
| Bienes | Servicios | |
| 2010 | 15.875.729.420 US$ | 3.533.066.693 US$ |
| 2009 | 13.932.561.664 US$ | 2.734.215.492 US$ |
| 2008 | 16.107.236.177 US$ | 3.171.166.633 US$ |
| 2007 | 12.276.793.014 US$ | 3.012.511.531 US$ |
| 2006 | 9.359.000.000 US$ | 2.520.000.000 US$ |
| 2005 | 8.742.000.000 US$ | 2.359.000.000 US$ |
| 2004 | 6.957.000.000 US$ | 2.235.000.000 US$ |
| 2003 | 4.382.000.000 US$ | 1.806.000.000 US$ |
| 2002 | 4.458.000.000 US$ | 1.883.000.000 US$ |
| 2001 | 4.282.000.000 US$ | 1.694.000.000 US$ |
| 2000 | 3.723.000.000 US$ | 1.667.000.000 US$ |
| 1999 | 3.590.000.000 US$ | 1.612.000.000 US$ |
| 1998 | 3.320.000.000 US$ | 1.491.000.000 US$ |
| 1997 | 3.603.000.000 US$ | 1.489.000.000 US$ |
| 1996 | 4.516.000.000 US$ | 1.555.000.000 US$ |
| 1995 | 4.004.000.000 US$ | 1.537.000.000 US$ |
| 1994 | 4.604.000.000 US$ | 1.611.000.000 US$ |
| 1993 | 3.512.000.000 US$ | 1.442.000.000 US$ |
| 1992 | 2.941.000.000 US$ | 1.102.100.000 US$ |
| 1991 | 2.354.000.000 US$ | 1.002.300.000 US$ |
| 1990 | 2.062.400.000 US$ | 892.300.000 US$ |
| 1989 | 1.820.600.000 US$ | 792.400.000 US$ |
| 1988 | 1.986.300.000 US$ | 636.400.000 US$ |
| 1987 | 2.225.800.000 US$ | 689.900.000 US$ |
| 1986 | 2.363.200.000 US$ | 698.800.000 US$ |
| 1985 | 3.945.700.000 US$ | 974.500.000 US$ |
| 1984 | 3.687.200.000 US$ | 905.500.000 US$ |
| 1983 | 4.024.000.000 US$ | 853.600.000 US$ |
| 1982 | 3.635.500.000 US$ | 757.000.000 US$ |
| 1981 | 4.404.000.000 US$ | 813.900.000 US$ |
| 1980 | 4.009.700.000 US$ | 521.000.000 US$ |
| 1979 | 3.055.100.000 US$ | 590.100.000 US$ |
| 1978 | 2.203.500.000 US$ | 579.400.000 US$ |
| 1977 | 2.402.000.000 US$ | 418.100.000 US$ |
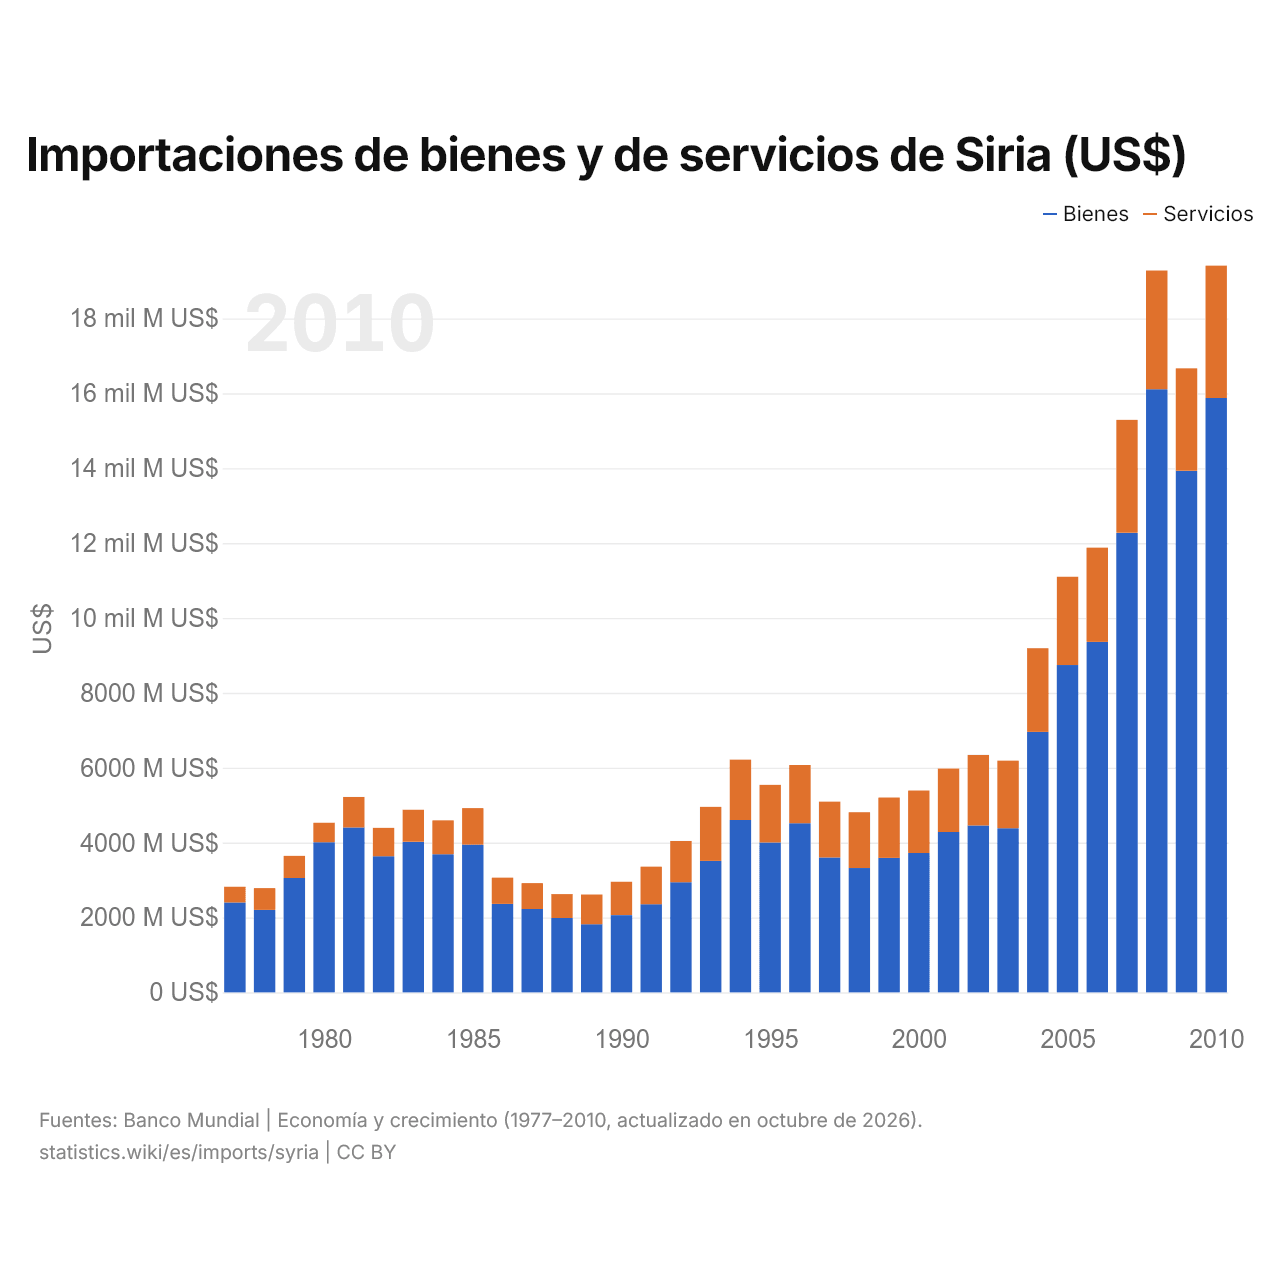
Las importaciones de bienes de Siria son de 15,9 mil millones de US$ (2010) y las de servicios, de 3,53 mil millones de US$; los servicios representan el 18,2 % del total, frente al 14,8 % en 1977.
Siria en la clasificación mundial de importaciones
| Puesto | País | Importaciones | Porcentaje del mundo | |
|---|---|---|---|---|
| 128 |
 Congo (Rep.) |
7120 M US$ (2025) | 0,02 % | |
| 129 |
 Zambia |
6970 M US$ (2024) | 0,02 % | |
| 130 |
 Turkmenistán |
6820 M US$ (2025) | 0,02 % | |
| 131 |
 Siria |
6800 M US$ | 0,02 % | |
| 132 |
 Bahamas |
6560 M US$ (2024) | 0,02 % | |
| 133 |
 Madagascar |
6460 M US$ (2025) | 0,02 % | |
| 134 |
 Mauritania |
6330 M US$ (2025) | 0,02 % |
Importaciones de bienes y servicios de Siria, % del PIB
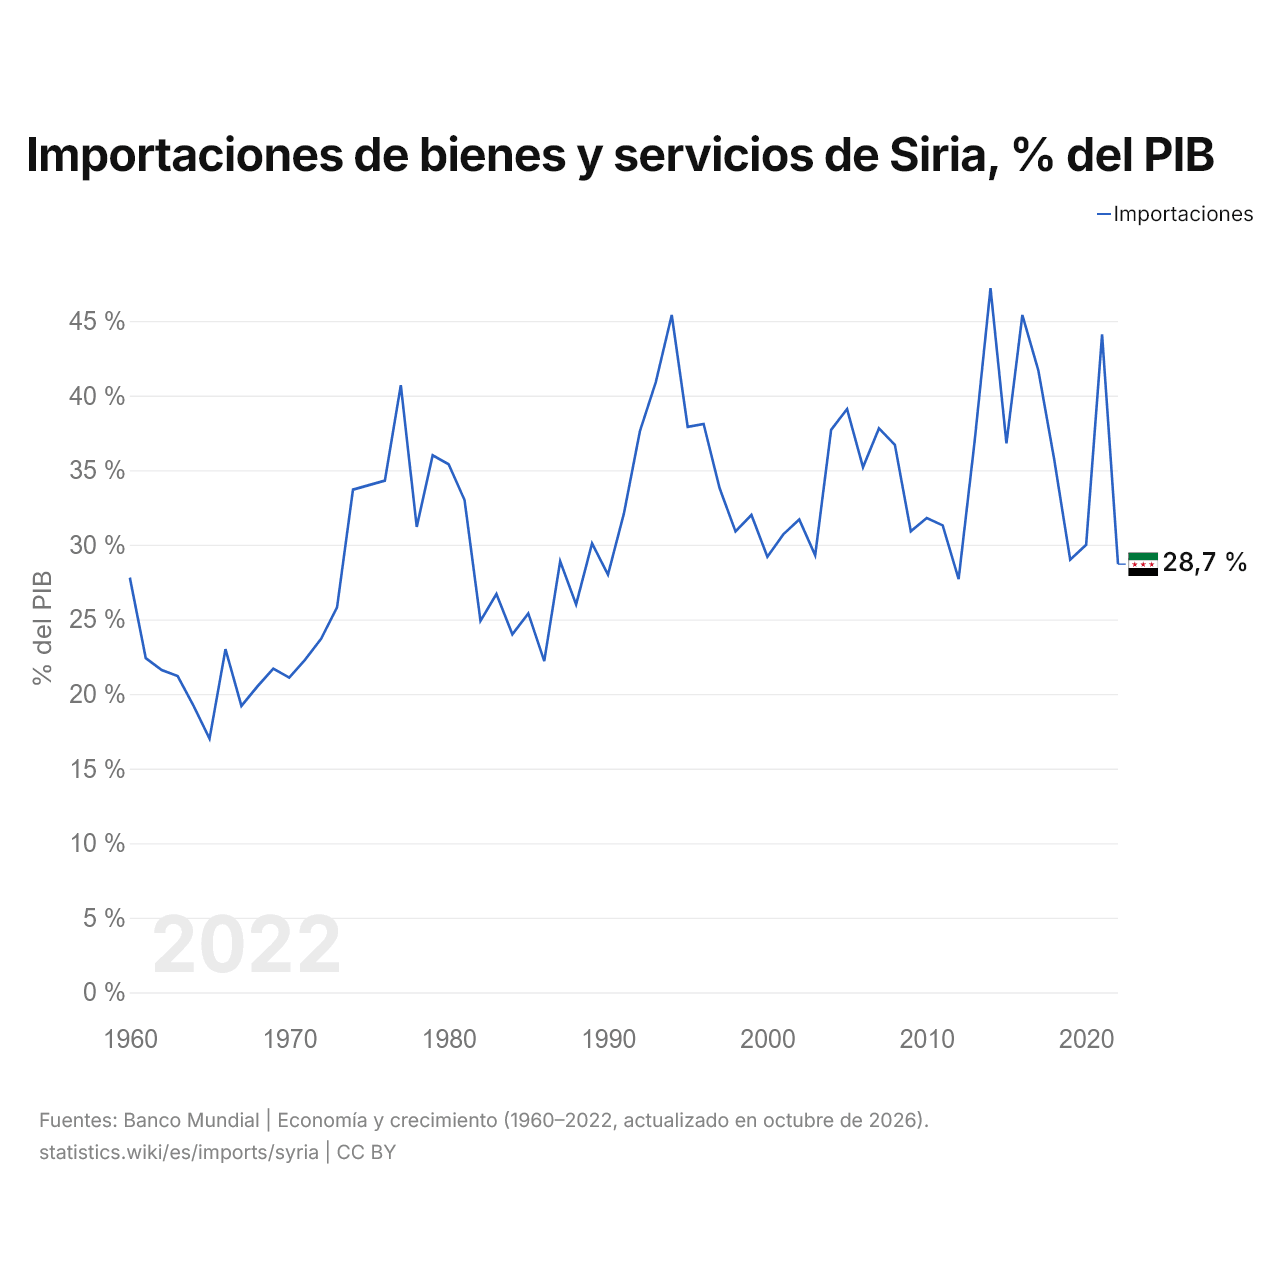
Las importaciones de bienes y servicios de Siria equivalen al 28,7 % de su PIB (2022), frente al 27,8 % en 1960. El porcentaje más alto fue del 47,2 %, en 2014.
Comparar las importaciones de Siria con otros países
Fuentes:
- Banco Mundial | Economía y crecimiento (1960–2025, actualizado en octubre de 2026)
- TradeMap (2010, actualizado en octubre de 2026)
Creative Commons Atribución (CC BY): puedes copiar, compartir, adaptar y reutilizar este contenido, también con fines comerciales, siempre que cites a statistics.wiki e indiques los cambios que hayas hecho. Las fuentes indicadas arriba pueden tener sus propias condiciones de licencia.