
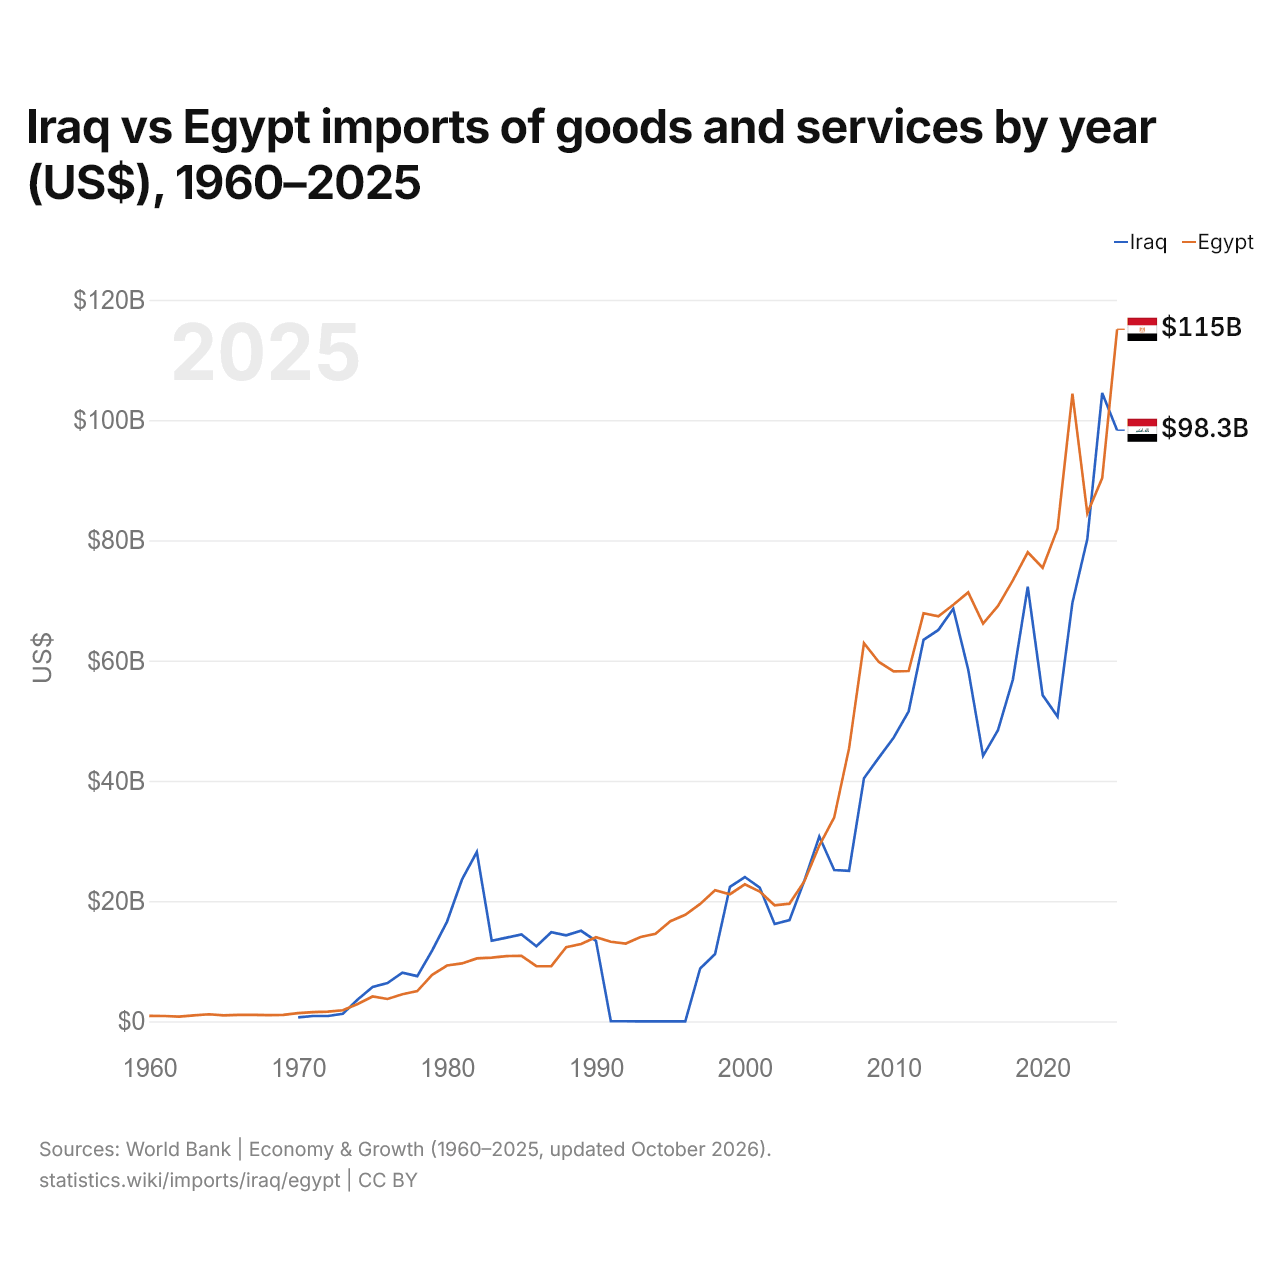
Irak vs Egipto: importaciones de bienes y servicios por año (US$), 1960–2025
1x
| Año | US$ | |
|---|---|---|
 Irak |
 Egipto |
|
| 2025 | 98.324.030.000 US$ | 115.107.510.878 US$ |
| 2024 | 104.517.100.000 US$ | 90.357.257.364 US$ |
| 2023 | 80.207.455.824 US$ | 84.507.685.810 US$ |
| 2022 | 69.638.475.862 US$ | 104.389.057.751 US$ |
| 2021 | 50.706.900.000 US$ | 81.943.913.321 US$ |
| 2020 | 54.255.237.619 US$ | 75.433.562.071 US$ |
| 2019 | 72.282.500.000 US$ | 78.012.528.474 US$ |
| 2018 | 56.839.934.052 US$ | 73.331.457.513 US$ |
| 2017 | 48.423.565.034 US$ | 69.089.673.913 US$ |
| 2016 | 44.153.354.784 US$ | 66.159.509.202 US$ |
| 2015 | 58.500.390.394 US$ | 71.347.708.895 US$ |
| 2014 | 68.617.800.000 US$ | 69.296.987.088 US$ |
| 2013 | 65.103.700.000 US$ | 67.364.341.085 US$ |
| 2012 | 63.439.263.881 US$ | 67.866.666.667 US$ |
| 2011 | 51.552.600.000 US$ | 58.261.617.900 US$ |
| 2010 | 47.207.400.000 US$ | 58.221.415.608 US$ |
| 2009 | 43.867.213.453 US$ | 59.764.065.336 US$ |
| 2008 | 40.441.477.852 US$ | 62.909.090.909 US$ |
| 2007 | 25.045.843.947 US$ | 45.429.071.804 US$ |
| 2006 | 25.158.864.322 US$ | 33.913.043.478 US$ |
| 2005 | 30.737.305.660 US$ | 29.237.429.237 US$ |
| 2004 | 23.432.019.002 US$ | 23.311.688.312 US$ |
| 2003 | 16.844.929.980 US$ | 19.576.923.077 US$ |
| 2002 | 16.198.164.181 US$ | 19.303.370.787 US$ |
| 2001 | 22.250.987.890 US$ | 21.590.296.496 US$ |
| 2000 | 24.004.542.302 US$ | 22.779.979.451 US$ |
| 1999 | 22.379.651.774 US$ | 21.144.205.249 US$ |
| 1998 | 11.204.358.033 US$ | 21.812.278.630 US$ |
| 1997 | 8.792.081.556 US$ | 19.528.023.599 US$ |
| 1996 | 1.849.551 US$ | 17.718.160.377 US$ |
| 1995 | 2.014.366 US$ | 16.661.751.696 US$ |
| 1994 | 2.555.117 US$ | 14.561.091.340 US$ |
| 1993 | 4.841.349 US$ | 14.015.606.242 US$ |
| 1992 | 7.412.217 US$ | 12.938.946.228 US$ |
| 1991 | 10.197.887 US$ | 13.226.985.710 US$ |
| 1990 | 13.400.645.161 US$ | 13.997.308.210 US$ |
| 1989 | 15.055.806.452 US$ | 12.856.257.745 US$ |
| 1988 | 14.299.677.419 US$ | 12.322.544.009 US$ |
| 1987 | 14.833.548.387 US$ | 9.190.887.667 US$ |
| 1986 | 12.495.483.871 US$ | 9.167.446.211 US$ |
| 1985 | 14.438.709.677 US$ | 10.888.912.156 US$ |
| 1984 | 13.923.870.968 US$ | 10.857.880.026 US$ |
| 1983 | 13.407.419.355 US$ | 10.593.713.620 US$ |
| 1982 | 28.158.000.000 US$ | 10.472.660.099 US$ |
| 1981 | 23.561.000.000 US$ | 9.628.783.784 US$ |
| 1980 | 16.592.000.000 US$ | 9.289.542.760 US$ |
| 1979 | 11.784.964.443 US$ | 7.743.714.286 US$ |
| 1978 | 7.520.487.640 US$ | 5.026.531.231 US$ |
| 1977 | 8.100.575.686 US$ | 4.516.926.855 US$ |
| 1976 | 6.376.227.565 US$ | 3.717.576.961 US$ |
| 1975 | 5.729.766.339 US$ | 4.134.809.294 US$ |
| 1974 | 3.636.302.066 US$ | 2.888.427.176 US$ |
| 1973 | 1.263.453.285 US$ | 1.834.007.074 US$ |
| 1972 | 883.748.874 US$ | 1.615.822.130 US$ |
| 1971 | 888.826.025 US$ | 1.530.986.993 US$ |
| 1970 | 662.479.735 US$ | 1.374.780.206 US$ |
| 1969 | - | 1.078.692.494 US$ |
| 1968 | - | 1.035.981.308 US$ |
| 1967 | - | 1.071.428.571 US$ |
| 1966 | - | 1.081.156.918 US$ |
| 1965 | - | 996.286.588 US$ |
| 1964 | - | 1.171.388.946 US$ |
| 1963 | - | 987.619.111 US$ |
| 1962 | - | 787.660.480 US$ |
| 1961 | - | 887.313.994 US$ |
| 1960 | - | 918.039.754 US$ |
En 2025, las importaciones de bienes y servicios de Irak fueron de 98,3 mil millones de US$ y las de Egipto, de 115 mil millones de US$: las de Egipto fueron un 17 % mayores. En 1970, las importaciones de Egipto fueron 2,1 veces mayores: 662 millones de US$ de Irak y 1,37 mil millones de US$ de Egipto.
Irak vs Egipto: cifras de importaciones
|
Irak
|
Egipto
|
|
|---|---|---|
| Importaciones | 98,3 mil M US$ (2025) | 115 mil M US$ (2025) |
| Puesto mundial | 50/174 | 46/174 |
| Porcentaje del mundo | 0,29 % | 0,34 % |
| % del PIB | 38,7 % | 31,5 % |
| Mayor categoría de bienes | Maquinaria, electrónica y vehículos (25,8 %, 2024) | Petróleo, gas, minerales y otras materias primas (25,2 %, 2025) |
| Principal origen de bienes | China (25,7 %, 2024) | China (18,6 %, 2025) |
Comparar las importaciones de 2 países cualesquiera
Fuentes:
- Banco Mundial | Economía y crecimiento (1960–2025, actualizado en octubre de 2026)
- TradeMap (2001–2025, actualizado en octubre de 2026)
Creative Commons Atribución (CC BY): puedes copiar, compartir, adaptar y reutilizar este contenido, también con fines comerciales, siempre que cites a statistics.wiki e indiques los cambios que hayas hecho. Las fuentes indicadas arriba pueden tener sus propias condiciones de licencia.