
PIB de San Cristóbal y Nieves, 1960–2025
| Año | PIB | Puesto mundial | |
|---|---|---|---|
| US$ corrientes | US$ constantes de 2015 | ||
| 2025 | 1.183.514.815 US$ | 1.043.449.133 US$ | 188.º |
| 2024 | 1.122.388.889 US$ | 1.016.129.628 US$ | 188.º |
| 2023 | 1.055.651.852 US$ | 1.012.966.874 US$ | 187.º |
| 2022 | 981.429.630 US$ | 983.259.886 US$ | 187.º |
| 2021 | 858.622.222 US$ | 889.985.054 US$ | 188.º |
| 2020 | 883.922.222 US$ | 886.725.391 US$ | 186.º |
| 2019 | 1.107.855.556 US$ | 1.046.924.639 US$ | 185.º |
| 2018 | 1.076.548.148 US$ | 1.017.041.453 US$ | 185.º |
| 2017 | 1.056.977.778 US$ | 997.065.002 US$ | 185.º |
| 2016 | 1.006.818.519 US$ | 994.866.931 US$ | 185.º |
| 2015 | 957.222.222 US$ | 957.222.222 US$ | 185.º |
| 2014 | 952.111.111 US$ | 950.623.606 US$ | 184.º |
| 2013 | 874.548.148 US$ | 883.668.355 US$ | 184.º |
| 2012 | 824.585.185 US$ | 835.799.755 US$ | 184.º |
| 2011 | 836.092.593 US$ | 842.010.736 US$ | 184.º |
| 2010 | 778.718.519 US$ | 828.615.281 US$ | 184.º |
| 2009 | 774.274.074 US$ | 829.064.586 US$ | 183.º |
| 2008 | 777.692.593 US$ | 858.287.029 US$ | 182.º |
| 2007 | 689.285.185 US$ | 771.029.360 US$ | 183.º |
| 2006 | 644.414.815 US$ | 766.426.187 US$ | 180.º |
| 2005 | 547.203.704 US$ | 743.018.278 US$ | 182.º |
| 2004 | 506.900.000 US$ | 677.115.811 US$ | 181.º |
| 2003 | 469.869.870 US$ | 651.095.767 US$ | 182.º |
| 2002 | 481.077.374 US$ | 677.754.528 US$ | 179.º |
| 2001 | 458.643.829 US$ | 668.609.851 US$ | 180.º |
| 2000 | 421.695.770 US$ | 635.237.944 US$ | 179.º |
| 1999 | 406.595.484 US$ | 577.264.388 US$ | 177.º |
| 1998 | 383.257.331 US$ | 559.256.949 US$ | 175.º |
| 1997 | 374.641.308 US$ | 561.992.423 US$ | 176.º |
| 1996 | 333.944.444 US$ | 526.092.075 US$ | 174.º |
| 1995 | 313.485.185 US$ | 497.050.235 US$ | 175.º |
| 1994 | 295.159.259 US$ | 471.660.099 US$ | 171.º |
| 1993 | 263.755.556 US$ | 447.913.010 US$ | 171.º |
| 1992 | 242.137.037 US$ | 419.386.549 US$ | 170.º |
| 1991 | 220.540.741 US$ | 402.216.051 US$ | 171.º |
| 1990 | 217.259.259 US$ | 409.858.640 US$ | 168.º |
| 1989 | 192.518.519 US$ | 390.798.418 US$ | 153.º |
| 1988 | 172.692.593 US$ | 370.496.001 US$ | 154.º |
| 1987 | 147.748.148 US$ | 339.203.231 US$ | 153.º |
| 1986 | 130.685.185 US$ | 318.350.194 US$ | 149.º |
| 1985 | 111.007.407 US$ | 287.171.953 US$ | 150.º |
| 1984 | 98.603.704 US$ | 264.552.531 US$ | 149.º |
| 1983 | 86.874.074 US$ | 243.007.917 US$ | 147.º |
| 1982 | 86.022.222 US$ | 240.157.914 US$ | 147.º |
| 1981 | 80.888.889 US$ | 238.849.643 US$ | 148.º |
| 1980 | 68.459.259 US$ | 235.211.154 US$ | 148.º |
| 1979 | 58.840.741 US$ | 216.904.179 US$ | 139.º |
| 1978 | 49.433.333 US$ | 201.588.165 US$ | 139.º |
| 1977 | 44.496.296 US$ | 194.002.840 US$ | 139.º |
| 1976 | 30.095.602 US$ | - | 138.º |
| 1975 | 33.364.055 US$ | - | 137.º |
| 1974 | 31.514.856 US$ | - | 137.º |
| 1973 | 24.196.018 US$ | - | 137.º |
| 1972 | 22.944.849 US$ | - | 135.º |
| 1971 | 19.624.746 US$ | - | 135.º |
| 1970 | 16.300.000 US$ | - | 136.º |
| 1969 | 15.850.000 US$ | - | 121.º |
| 1968 | 14.600.000 US$ | - | 121.º |
| 1967 | 16.742.338 US$ | - | 118.º |
| 1966 | 14.469.078 US$ | - | 117.º |
| 1965 | 13.593.932 US$ | - | 116.º |
| 1964 | 13.416.633 US$ | - | 113.º |
| 1963 | 12.833.301 US$ | - | 113.º |
| 1962 | 12.541.635 US$ | - | 113.º |
| 1961 | 12.483.302 US$ | - | 110.º |
| 1960 | 12.366.636 US$ | - | 108.º |
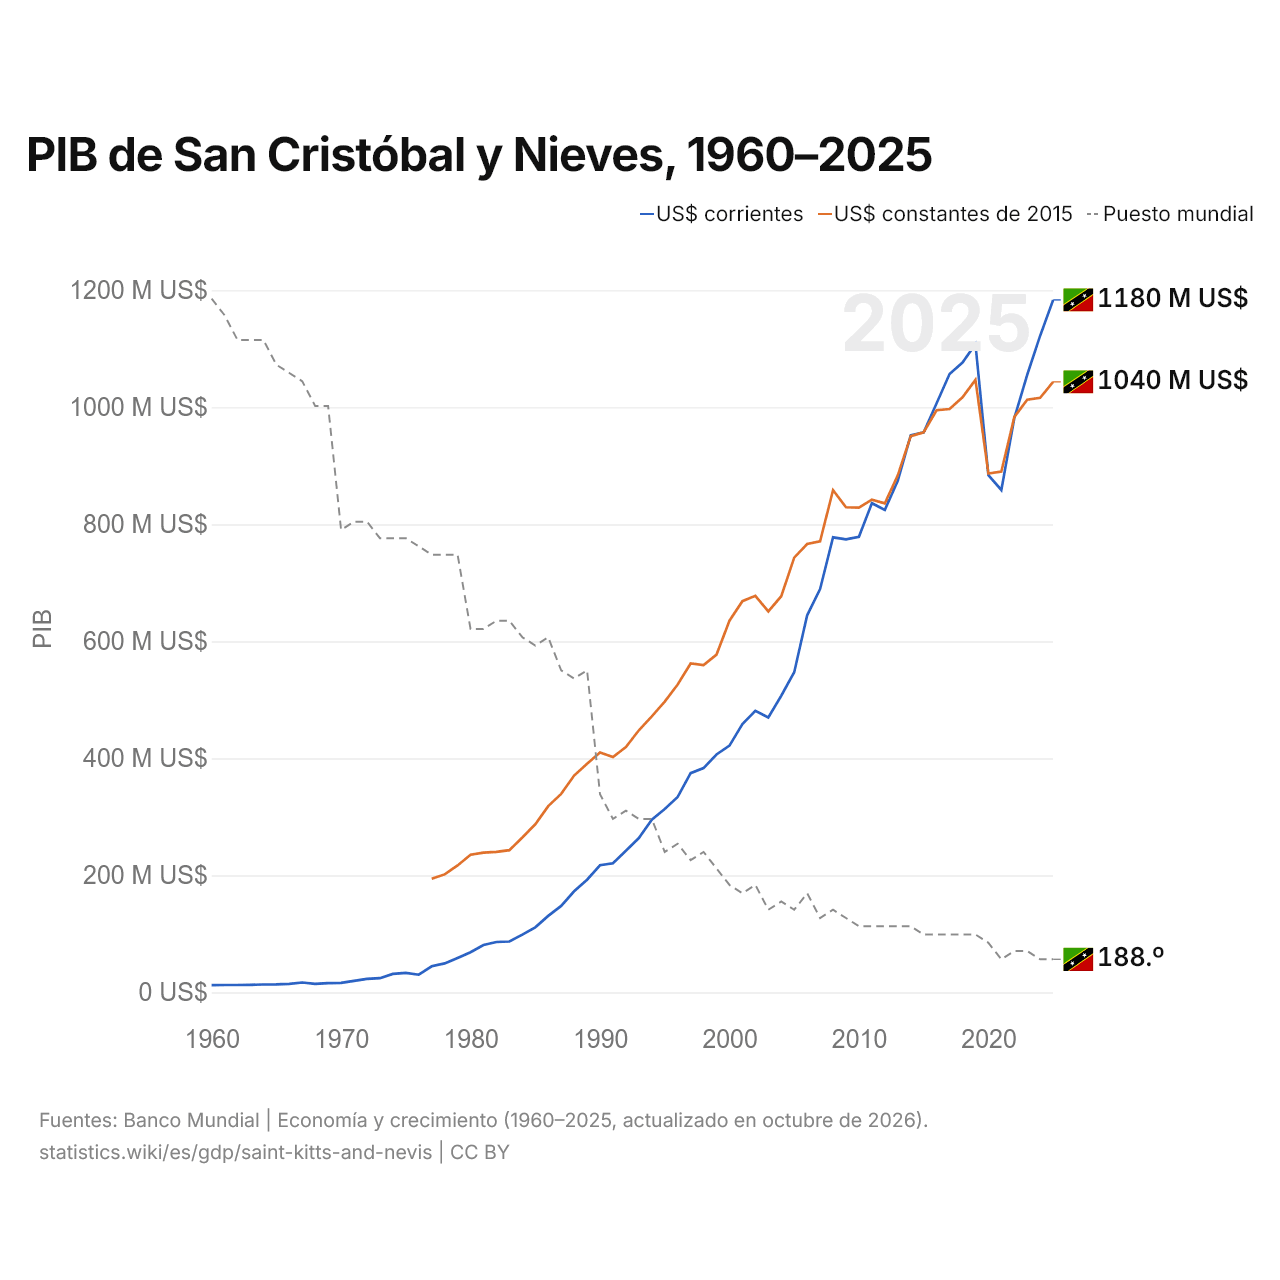
El PIB de San Cristóbal y Nieves fue de 1,18 mil millones de US$ en 2025, menos del 0,01 % del PIB mundial. Ocupó el puesto 188 del mundo, que mantiene desde 2024. Su mejor posición fue el puesto 108, por última vez en 1960. A precios constantes de 2015, el PIB creció un 2,7 % en 2025 y un 9,0 % en los diez años desde 2015.
A precios constantes de 2015, el PIB de San Cristóbal y Nieves en 2025 fue 5,4 veces el de 1977, con un crecimiento medio del 3,6 % anual. Desde 1980, por décadas, el crecimiento fue más rápido de 1980 a 1990, un 5,7 % anual, y más lento de 2010 a 2020, un 0,7 % anual.
El PIB de San Cristóbal y Nieves fue el 34.º mayor de los 35 países de América Latina, y el 0,016 % del total de la región. Su PIB per cápita fue de 25.223 US$ en 2025, el puesto 53 del mundo. En paridad de poder adquisitivo, su PIB (PPA) fue de 1,73 mil millones de dólares en 2025, el puesto 187 del mundo.
San Cristóbal y Nieves en la clasificación mundial del PIB, 2025
| Puesto | País | PIB | Porcentaje del mundo | |
|---|---|---|---|---|
| 185 |
 Vanuatu |
1350 M US$ | 0,001 % | |
| 186 |
 Samoa |
1290 M US$ | 0,001 % | |
| 187 |
 San Vicente [...] |
1260 M US$ | 0,001 % | |
| 188 |
 San Cristóbal |
1180 M US$ | 0,001 % | |
| 189 |
 Santo Tomé |
981 M US$ | <0,001 % | |
| 190 |
 Dominica |
724 M US$ | <0,001 % | |
| 191 |
 Tonga |
679 M US$ | <0,001 % |
Comparar el PIB de San Cristóbal y Nieves con otros países
Fuentes:
- Banco Mundial | Economía y crecimiento (1960–2025, actualizado en octubre de 2026)
Creative Commons Atribución (CC BY): puedes copiar, compartir, adaptar y reutilizar este contenido, también con fines comerciales, siempre que cites a statistics.wiki e indiques los cambios que hayas hecho. Las fuentes indicadas arriba pueden tener sus propias condiciones de licencia.