
PIB per cápita de San Cristóbal y Nieves, 1960–2025
| Año | PIB per cápita | Puesto mundial | |
|---|---|---|---|
| US$ corrientes | US$ constantes de 2015 | ||
| 2025 | 25.223 US$ | 22.238 US$ | #53 |
| 2024 | 23.961 US$ | 21.692 US$ | #52 |
| 2023 | 22.577 US$ | 21.664 US$ | #50 |
| 2022 | 21.012 US$ | 21.051 US$ | #48 |
| 2021 | 18.361 US$ | 19.032 US$ | #52 |
| 2020 | 18.859 US$ | 18.919 US$ | #47 |
| 2019 | 23.595 US$ | 22.298 US$ | #42 |
| 2018 | 22.901 US$ | 21.635 US$ | #43 |
| 2017 | 22.465 US$ | 21.192 US$ | #40 |
| 2016 | 21.388 US$ | 21.134 US$ | #40 |
| 2015 | 20.329 US$ | 20.329 US$ | #41 |
| 2014 | 20.219 US$ | 20.188 US$ | #46 |
| 2013 | 18.580 US$ | 18.774 US$ | #49 |
| 2012 | 17.532 US$ | 17.770 US$ | #49 |
| 2011 | 17.832 US$ | 17.959 US$ | #49 |
| 2010 | 16.623 US$ | 17.688 US$ | #49 |
| 2009 | 16.503 US$ | 17.671 US$ | #47 |
| 2008 | 16.605 US$ | 18.326 US$ | #52 |
| 2007 | 14.758 US$ | 16.508 US$ | #50 |
| 2006 | 13.838 US$ | 16.458 US$ | #49 |
| 2005 | 11.784 US$ | 16.001 US$ | #49 |
| 2004 | 10.945 US$ | 14.620 US$ | #47 |
| 2003 | 10.176 US$ | 14.100 US$ | #46 |
| 2002 | 10.454 US$ | 14.727 US$ | #45 |
| 2001 | 10.023 US$ | 14.611 US$ | #45 |
| 2000 | 9.320 US$ | 14.039 US$ | #46 |
| 1999 | 9.116 US$ | 12.943 US$ | #44 |
| 1998 | 8.711 US$ | 12.711 US$ | #43 |
| 1997 | 8.627 US$ | 12.941 US$ | #44 |
| 1996 | 7.788 US$ | 12.270 US$ | #44 |
| 1995 | 7.406 US$ | 11.743 US$ | #44 |
| 1994 | 7.065 US$ | 11.290 US$ | #45 |
| 1993 | 6.395 US$ | 10.861 US$ | #47 |
| 1992 | 5.947 US$ | 10.301 US$ | #48 |
| 1991 | 5.465 US$ | 9.966 US$ | #48 |
| 1990 | 5.373 US$ | 10.137 US$ | #50 |
| 1989 | 4.723 US$ | 9.588 US$ | #46 |
| 1988 | 4.206 US$ | 9.023 US$ | #47 |
| 1987 | 3.573 US$ | 8.204 US$ | #49 |
| 1986 | 3.140 US$ | 7.649 US$ | #51 |
| 1985 | 2.651 US$ | 6.858 US$ | #54 |
| 1984 | 2.341 US$ | 6.282 US$ | #59 |
| 1983 | 2.052 US$ | 5.740 US$ | #62 |
| 1982 | 2.023 US$ | 5.647 US$ | #66 |
| 1981 | 1.894 US$ | 5.594 US$ | #67 |
| 1980 | 1.598 US$ | 5.489 US$ | #72 |
| 1979 | 1.367 US$ | 5.040 US$ | #70 |
| 1978 | 1.144 US$ | 4.665 US$ | #71 |
| 1977 | 1.026 US$ | 4.474 US$ | #71 |
| 1976 | 692 US$ | - | #77 |
| 1975 | 765 US$ | - | #69 |
| 1974 | 721 US$ | - | #71 |
| 1973 | 551 US$ | - | #72 |
| 1972 | 521 US$ | - | #66 |
| 1971 | 444 US$ | - | #64 |
| 1970 | 365 US$ | - | #72 |
| 1969 | 347 US$ | - | #59 |
| 1968 | 309 US$ | - | #63 |
| 1967 | 344 US$ | - | #52 |
| 1966 | 290 US$ | - | #60 |
| 1965 | 265,8 US$ | - | #67 |
| 1964 | 256,4 US$ | - | #60 |
| 1963 | 240,1 US$ | - | #61 |
| 1962 | 230,3 US$ | - | #62 |
| 1961 | 225,6 US$ | - | #60 |
| 1960 | 221,6 US$ | - | #60 |
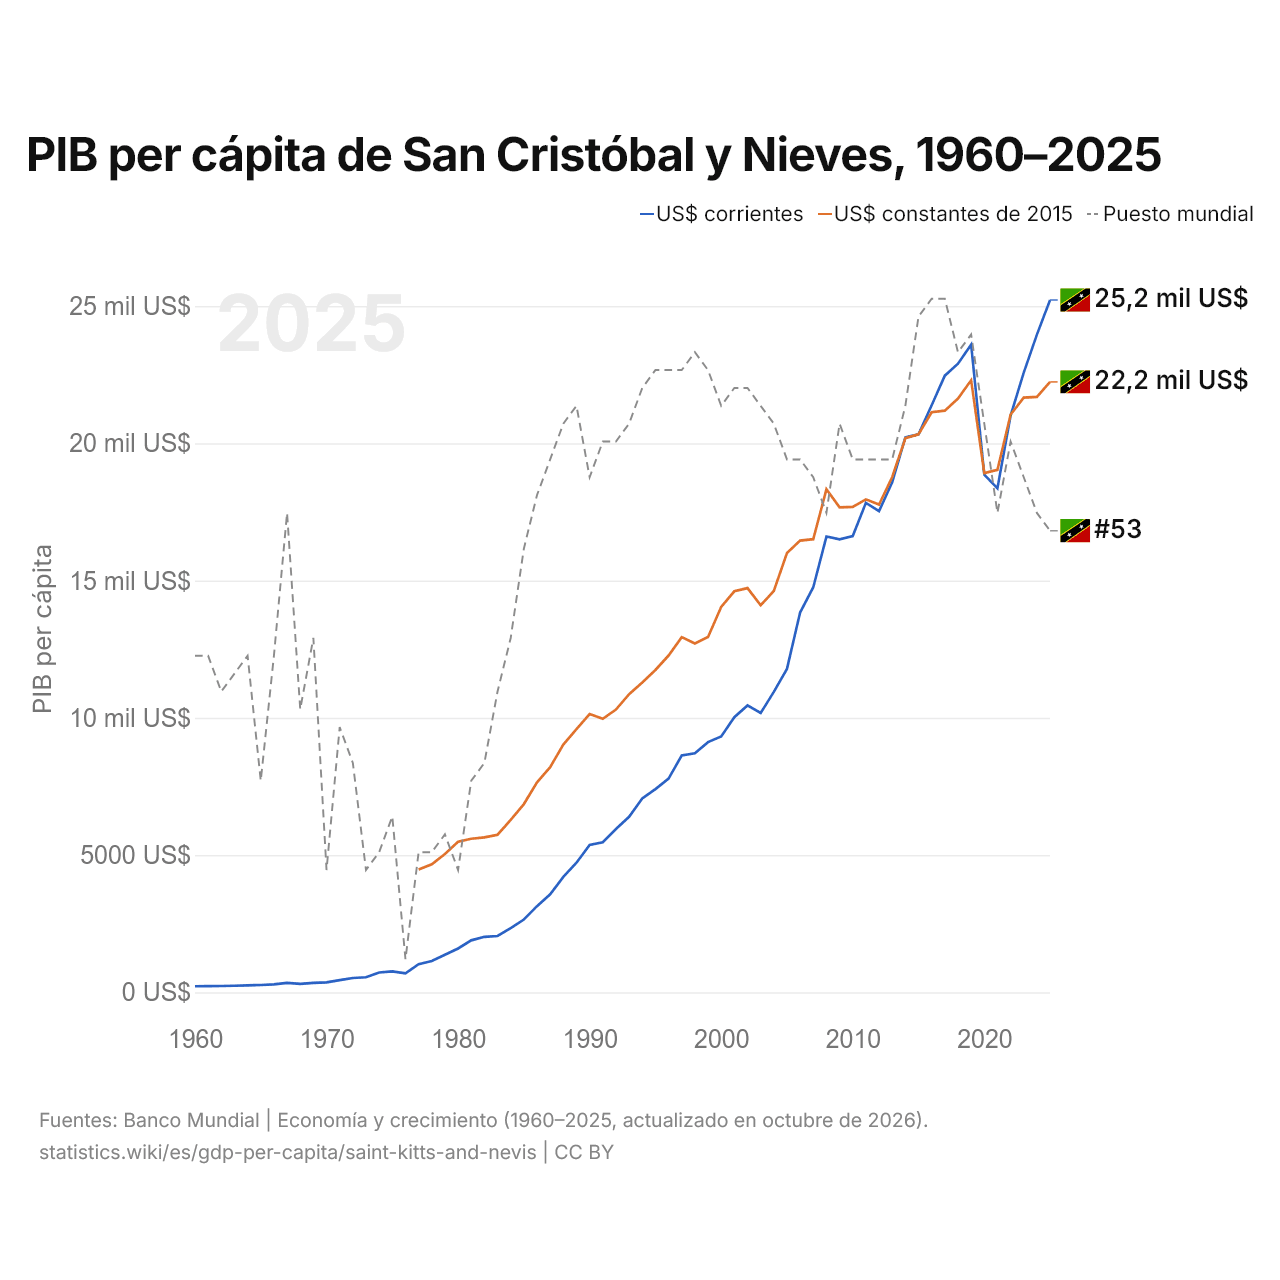
En 2025, el PIB per cápita de San Cristóbal y Nieves fue de 25.223 US$, más que los 222 US$ de 1960. El de San Cristóbal y Nieves equivalía a 1,8 veces el PIB per cápita mundial, de 14.406 US$. Ocupó el puesto 53 del mundo; en 2024, el 52. Su mejor posición fue el puesto 40, por última vez en 2017. A precios constantes de 2015, el PIB per cápita creció un 2,5 % en 2025 y un 9,4 % en los diez años desde 2015.
A precios constantes de 2015, el PIB per cápita de San Cristóbal y Nieves en 2025 fue 5 veces el de 1977, con un crecimiento medio del 3,4 % anual. Desde 1980, por décadas, el PIB per cápita de San Cristóbal y Nieves creció más rápido de 1980 a 1990, un 6,3 % anual, y más lento de 2010 a 2020, un 0,7 % anual.
El PIB per cápita de San Cristóbal y Nieves fue el 5.º más alto de los 35 países de América Latina, donde iba desde 2694 US$ en Haití hasta 104.293 US$ en las Islas Caimán (2024). El PIB per cápita (PPA) de San Cristóbal y Nieves fue de 36.777 dólares en 2025, el puesto 64 del mundo.
San Cristóbal y Nieves en la clasificación mundial del PIB per cápita, 2025







Comparar el PIB per cápita de San Cristóbal y Nieves con otros países
Fuentes:
- Banco Mundial | Economía y crecimiento (1960–2025, actualizado en octubre de 2026)
Creative Commons Atribución (CC BY): puedes copiar, compartir, adaptar y reutilizar este contenido, también con fines comerciales, siempre que cites a statistics.wiki e indiques los cambios que hayas hecho. Las fuentes indicadas arriba pueden tener sus propias condiciones de licencia.