
Vietnam vs Irán: PIB per cápita, 1960–2025
| Año | PIB per cápita, US$ corrientes | |
|---|---|---|
 Vietnam |
 Irán |
|
| 2025 | 5.066 US$ | 3.924 US$ |
| 2024 | 4.717 US$ | 5.190 US$ |
| 2023 | 4.323 US$ | 5.049 US$ |
| 2022 | 4.148 US$ | 4.721 US$ |
| 2021 | 3.704 US$ | 4.605 US$ |
| 2020 | 3.534 US$ | 3.203 US$ |
| 2019 | 3.441 US$ | 3.997 US$ |
| 2018 | 3.222 US$ | 4.783 US$ |
| 2017 | 2.956 US$ | 6.001 US$ |
| 2016 | 2.735 US$ | 5.711 US$ |
| 2015 | 2.578 US$ | 4.953 US$ |
| 2014 | 2.546 US$ | 5.672 US$ |
| 2013 | 2.360 US$ | 6.223 US$ |
| 2012 | 2.185 US$ | 8.114 US$ |
| 2011 | 1.951 US$ | 8.026 US$ |
| 2010 | 1.683 US$ | 6.291 US$ |
| 2009 | 1.226 US$ | 5.416 US$ |
| 2008 | 1.164 US$ | 5.377 US$ |
| 2007 | 926 US$ | 4.688 US$ |
| 2006 | 808 US$ | 3.619 US$ |
| 2005 | 711 US$ | 3.132 US$ |
| 2004 | 565 US$ | 2.672 US$ |
| 2003 | 497 US$ | 2.209 US$ |
| 2002 | 445 US$ | 1.891 US$ |
| 2001 | 419 US$ | 1.881 US$ |
| 2000 | 404 US$ | 1.650 US$ |
| 1999 | 376 US$ | 1.740 US$ |
| 1998 | 361 US$ | 1.709 US$ |
| 1997 | 362 US$ | 1.790 US$ |
| 1996 | 337 US$ | 1.915 US$ |
| 1995 | 287,8 US$ | 1.550 US$ |
| 1994 | 229,9 US$ | 1.168 US$ |
| 1993 | 189,4 US$ | 1.038 US$ |
| 1992 | 144,5 US$ | 1.957 US$ |
| 1991 | 143,7 US$ | 2.194 US$ |
| 1990 | 98,8 US$ | 2.138 US$ |
| 1989 | 98,1 US$ | 2.125 US$ |
| 1988 | 405 US$ | 2.234 US$ |
| 1987 | 595 US$ | 2.513 US$ |
| 1986 | 436 US$ | 4.064 US$ |
| 1985 | 238,6 US$ | 3.634 US$ |
| 1984 | - | 3.395 US$ |
| 1983 | - | 3.397 US$ |
| 1982 | - | 2.845 US$ |
| 1981 | - | 2.393 US$ |
| 1980 | - | 2.368 US$ |
| 1979 | - | 2.352 US$ |
| 1978 | - | 2.101 US$ |
| 1977 | - | 2.243 US$ |
| 1976 | - | 1.954 US$ |
| 1975 | - | 1.532 US$ |
| 1974 | - | 1.409 US$ |
| 1973 | - | 851 US$ |
| 1972 | - | 555 US$ |
| 1971 | - | 457 US$ |
| 1970 | - | 377 US$ |
| 1969 | - | 345 US$ |
| 1968 | - | 314 US$ |
| 1967 | - | 283,7 US$ |
| 1966 | - | 262,9 US$ |
| 1965 | - | 247,5 US$ |
| 1964 | - | 221,7 US$ |
| 1963 | - | 209,6 US$ |
| 1962 | - | 205,8 US$ |
| 1961 | - | 200,1 US$ |
| 1960 | - | 195,6 US$ |
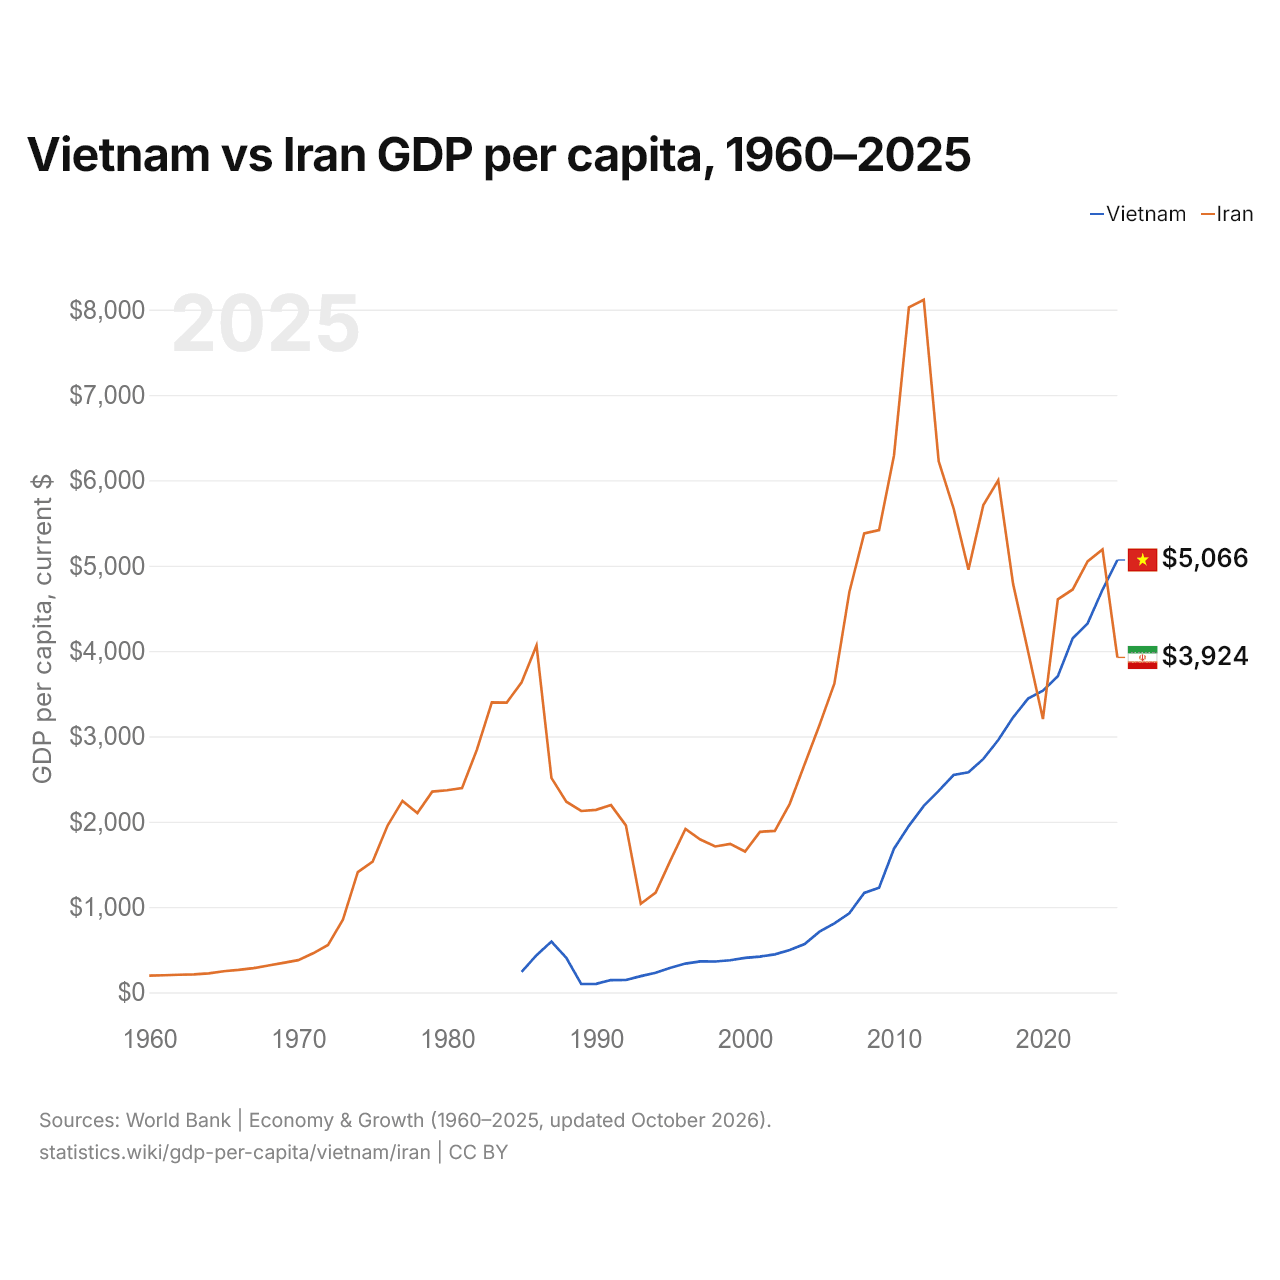
En 2025, el PIB per cápita fue de 5066 US$ en Vietnam y de 3924 US$ en Irán: un 29 % más alto en Vietnam. En 1985 era de 239 US$ en Vietnam y de 3634 US$ en Irán, 15 veces más alto en Irán.
A precios constantes de 2015, de 1984 a 2025, el PIB per cápita de Vietnam creció un 623 %, y el de Irán creció un 48 %. En paridad de poder adquisitivo el orden se invierte: el PIB per cápita (PPA) es de 19.699 dólares en Irán y de 18.088 dólares en Vietnam.
Vietnam vs Irán: últimos datos del PIB per cápita
Comparar el PIB per cápita de 2 países cualesquiera
Fuentes:
- Banco Mundial | Economía y crecimiento (1960–2025, actualizado en octubre de 2026)
Creative Commons Atribución (CC BY): puedes copiar, compartir, adaptar y reutilizar este contenido, también con fines comerciales, siempre que cites a statistics.wiki e indiques los cambios que hayas hecho. Las fuentes indicadas arriba pueden tener sus propias condiciones de licencia.