
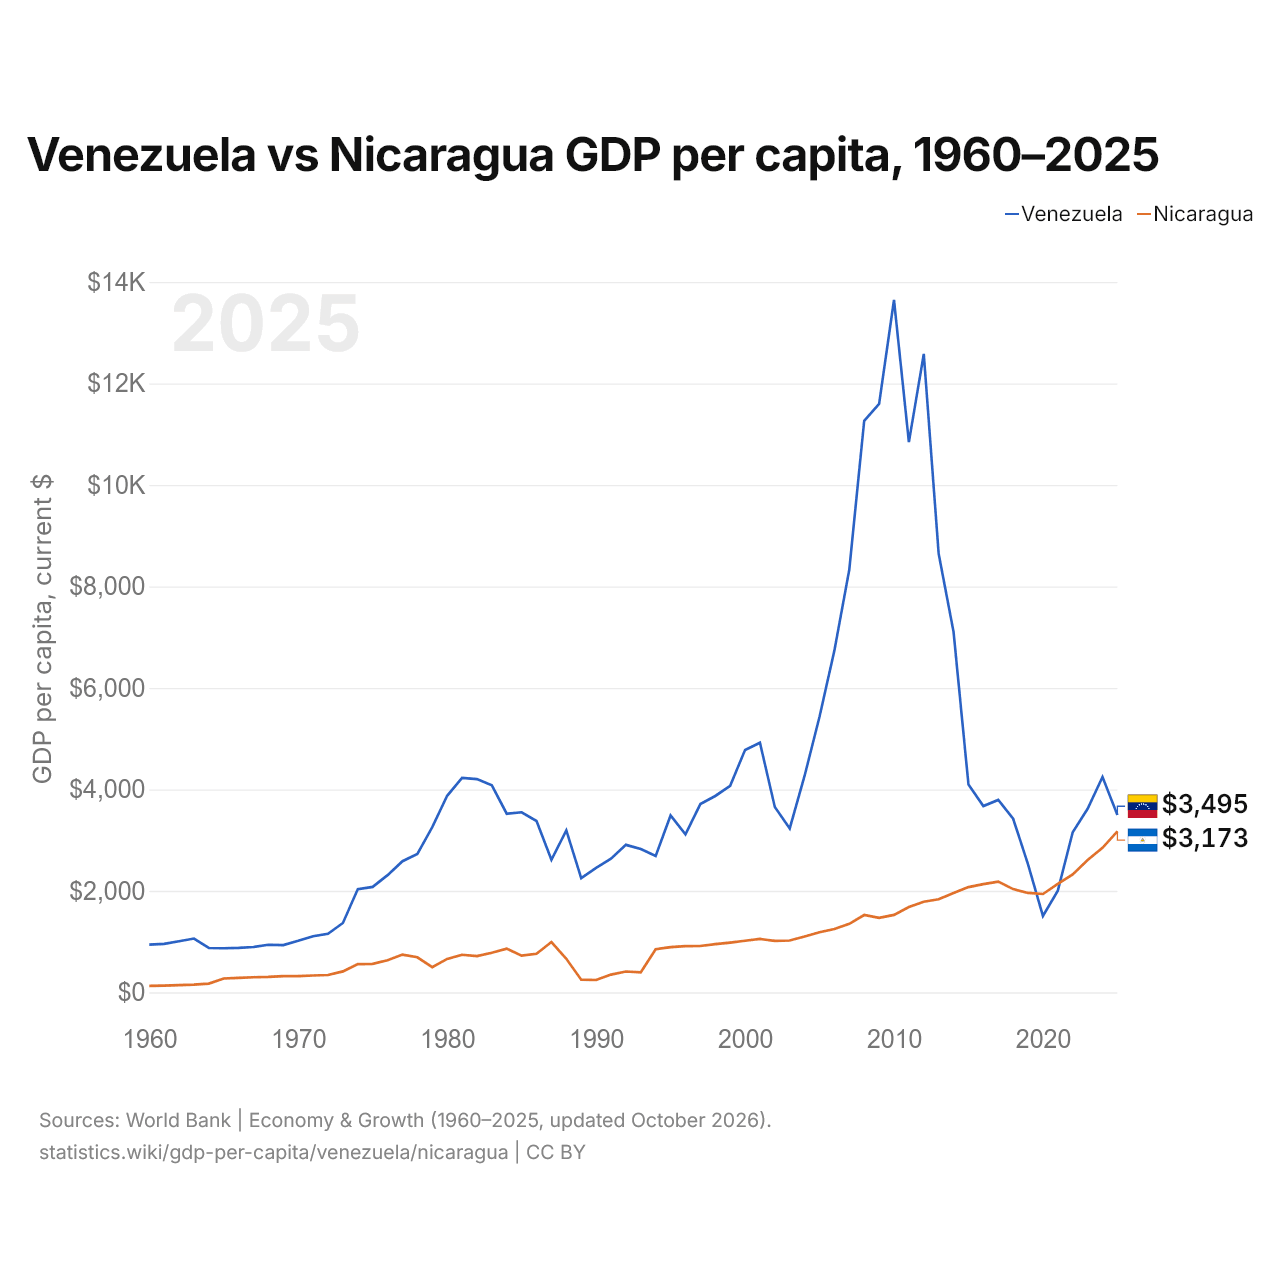
Venezuela vs Nicaragua: PIB per cápita, 1960–2025
| Año | PIB per cápita, US$ corrientes | |
|---|---|---|
 Venezuela |
 Nicaragua |
|
| 2025 | 3.495 US$ | 3.173 US$ |
| 2024 | 4.244 US$ | 2.848 US$ |
| 2023 | 3.617 US$ | 2.609 US$ |
| 2022 | 3.155 US$ | 2.323 US$ |
| 2021 | 2.005 US$ | 2.138 US$ |
| 2020 | 1.506 US$ | 1.938 US$ |
| 2019 | 2.523 US$ | 1.959 US$ |
| 2018 | 3.422 US$ | 2.035 US$ |
| 2017 | 3.792 US$ | 2.183 US$ |
| 2016 | 3.671 US$ | 2.132 US$ |
| 2015 | 4.097 US$ | 2.074 US$ |
| 2014 | 7.101 US$ | 1.958 US$ |
| 2013 | 8.642 US$ | 1.835 US$ |
| 2012 | 12.582 US$ | 1.785 US$ |
| 2011 | 10.844 US$ | 1.680 US$ |
| 2010 | 13.646 US$ | 1.527 US$ |
| 2009 | 11.597 US$ | 1.467 US$ |
| 2008 | 11.262 US$ | 1.524 US$ |
| 2007 | 8.332 US$ | 1.350 US$ |
| 2006 | 6.739 US$ | 1.248 US$ |
| 2005 | 5.432 US$ | 1.183 US$ |
| 2004 | 4.269 US$ | 1.099 US$ |
| 2003 | 3.230 US$ | 1.021 US$ |
| 2002 | 3.652 US$ | 1.014 US$ |
| 2001 | 4.920 US$ | 1.052 US$ |
| 2000 | 4.776 US$ | 1.017 US$ |
| 1999 | 4.071 US$ | 980 US$ |
| 1998 | 3.870 US$ | 949 US$ |
| 1997 | 3.711 US$ | 913 US$ |
| 1996 | 3.113 US$ | 911 US$ |
| 1995 | 3.487 US$ | 892 US$ |
| 1994 | 2.689 US$ | 849 US$ |
| 1993 | 2.825 US$ | 394 US$ |
| 1992 | 2.907 US$ | 411 US$ |
| 1991 | 2.633 US$ | 350 US$ |
| 1990 | 2.452 US$ | 242,5 US$ |
| 1989 | 2.250 US$ | 249,2 US$ |
| 1988 | 3.191 US$ | 662 US$ |
| 1987 | 2.611 US$ | 992 US$ |
| 1986 | 3.376 US$ | 761 US$ |
| 1985 | 3.549 US$ | 724 US$ |
| 1984 | 3.520 US$ | 861 US$ |
| 1983 | 4.079 US$ | 780 US$ |
| 1982 | 4.202 US$ | 714 US$ |
| 1981 | 4.228 US$ | 740 US$ |
| 1980 | 3.874 US$ | 659 US$ |
| 1979 | 3.257 US$ | 495 US$ |
| 1978 | 2.727 US$ | 691 US$ |
| 1977 | 2.585 US$ | 744 US$ |
| 1976 | 2.309 US$ | 633 US$ |
| 1975 | 2.078 US$ | 561 US$ |
| 1974 | 2.034 US$ | 557 US$ |
| 1973 | 1.367 US$ | 413 US$ |
| 1972 | 1.155 US$ | 341 US$ |
| 1971 | 1.106 US$ | 331 US$ |
| 1970 | 1.015 US$ | 321 US$ |
| 1969 | 932 US$ | 319 US$ |
| 1968 | 938 US$ | 304 US$ |
| 1967 | 893 US$ | 297,9 US$ |
| 1966 | 876 US$ | 284 US$ |
| 1965 | 869 US$ | 272,3 US$ |
| 1964 | 874 US$ | 172,7 US$ |
| 1963 | 1.060 US$ | 152,5 US$ |
| 1962 | 1.007 US$ | 142,3 US$ |
| 1961 | 954 US$ | 132,9 US$ |
| 1960 | 939 US$ | 127,5 US$ |
En 2025, el PIB per cápita fue de 3495 US$ en Venezuela y de 3173 US$ en Nicaragua: un 10 % más alto en Venezuela. En 1960 era de 939 US$ en Venezuela y de 127 US$ en Nicaragua, 7,4 veces más alto en Venezuela.
El PIB per cápita de Venezuela ha sido más alto que el de Nicaragua todos los años desde 2022. A precios constantes de 2015, de 1960 a 2025, el PIB per cápita de Venezuela cayó un 63 %, y el de Nicaragua creció un 42 %.
Venezuela vs Nicaragua: últimos datos del PIB per cápita
Comparar el PIB per cápita de 2 países cualesquiera
Fuentes:
- Banco Mundial | Economía y crecimiento (1960–2025, actualizado en octubre de 2026)
Creative Commons Atribución (CC BY): puedes copiar, compartir, adaptar y reutilizar este contenido, también con fines comerciales, siempre que cites a statistics.wiki e indiques los cambios que hayas hecho. Las fuentes indicadas arriba pueden tener sus propias condiciones de licencia.