
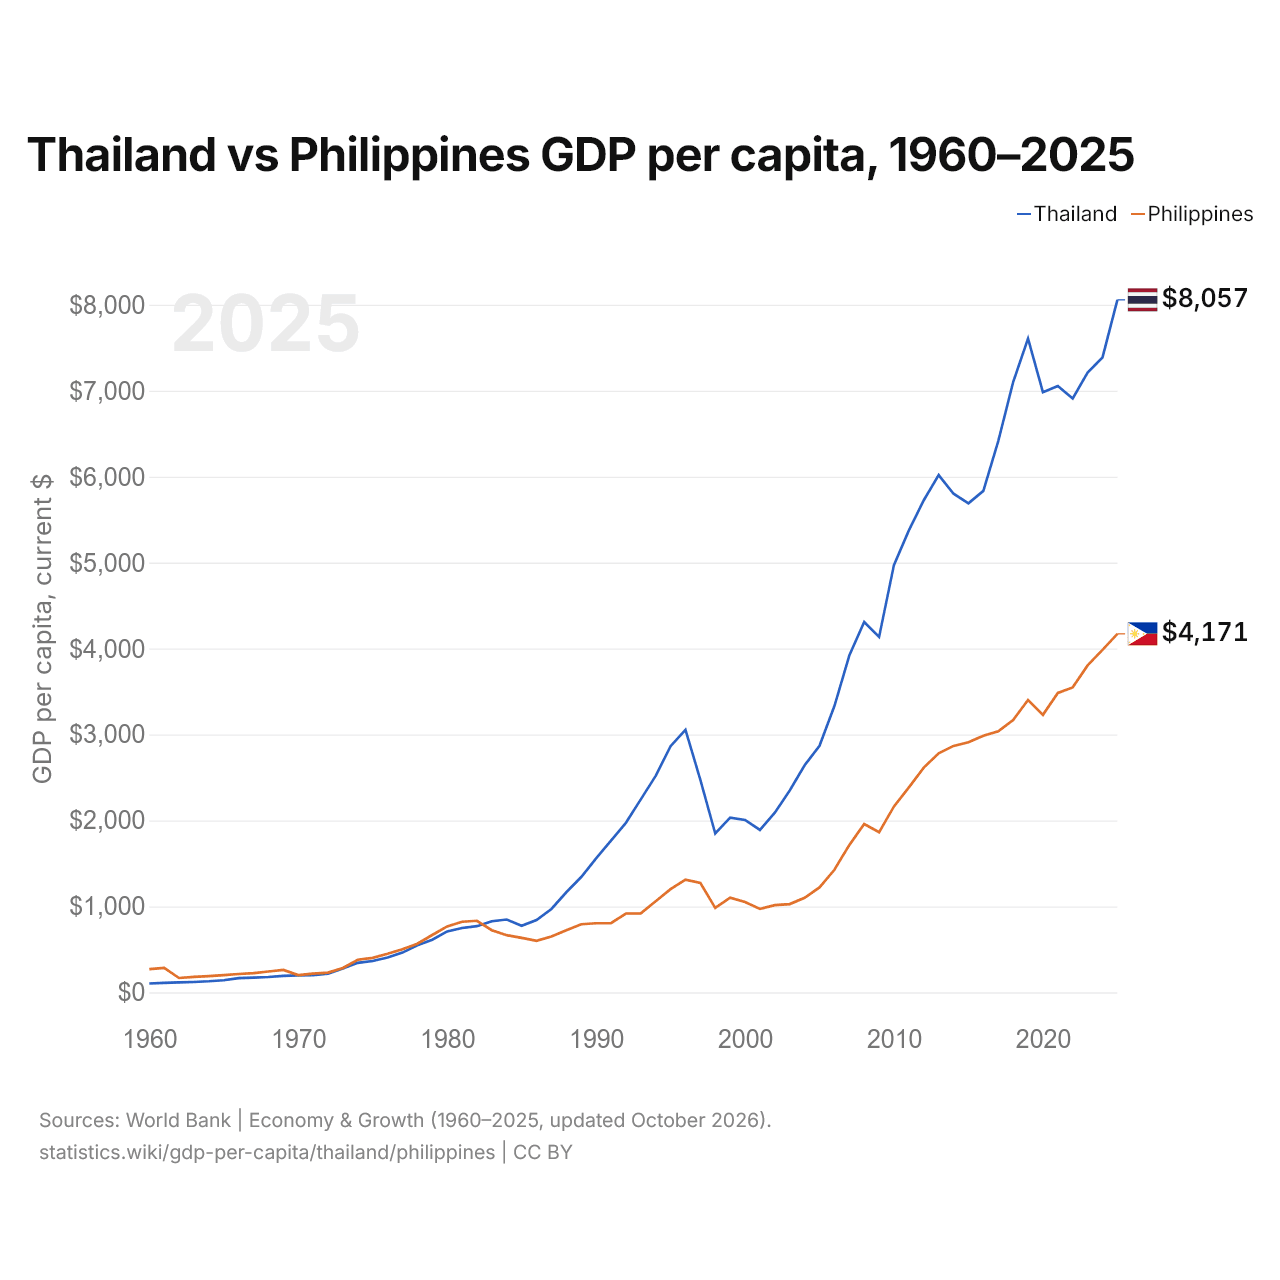
Tailandia vs Filipinas: PIB per cápita, 1960–2025
| Año | PIB per cápita, US$ corrientes | |
|---|---|---|
 Tailandia |
 Filipinas |
|
| 2025 | 8.057 US$ | 4.171 US$ |
| 2024 | 7.387 US$ | 3.985 US$ |
| 2023 | 7.211 US$ | 3.804 US$ |
| 2022 | 6.910 US$ | 3.548 US$ |
| 2021 | 7.055 US$ | 3.484 US$ |
| 2020 | 6.983 US$ | 3.228 US$ |
| 2019 | 7.606 US$ | 3.401 US$ |
| 2018 | 7.100 US$ | 3.169 US$ |
| 2017 | 6.413 US$ | 3.038 US$ |
| 2016 | 5.834 US$ | 2.985 US$ |
| 2015 | 5.689 US$ | 2.910 US$ |
| 2014 | 5.801 US$ | 2.867 US$ |
| 2013 | 6.018 US$ | 2.781 US$ |
| 2012 | 5.726 US$ | 2.615 US$ |
| 2011 | 5.374 US$ | 2.384 US$ |
| 2010 | 4.974 US$ | 2.163 US$ |
| 2009 | 4.135 US$ | 1.864 US$ |
| 2008 | 4.309 US$ | 1.959 US$ |
| 2007 | 3.919 US$ | 1.713 US$ |
| 2006 | 3.331 US$ | 1.426 US$ |
| 2005 | 2.868 US$ | 1.220 US$ |
| 2004 | 2.642 US$ | 1.100 US$ |
| 2003 | 2.348 US$ | 1.027 US$ |
| 2002 | 2.090 US$ | 1.015 US$ |
| 2001 | 1.890 US$ | 970 US$ |
| 2000 | 2.006 US$ | 1.051 US$ |
| 1999 | 2.033 US$ | 1.101 US$ |
| 1998 | 1.848 US$ | 983 US$ |
| 1997 | 2.473 US$ | 1.273 US$ |
| 1996 | 3.055 US$ | 1.311 US$ |
| 1995 | 2.864 US$ | 1.200 US$ |
| 1994 | 2.518 US$ | 1.060 US$ |
| 1993 | 2.245 US$ | 919 US$ |
| 1992 | 1.972 US$ | 917 US$ |
| 1991 | 1.766 US$ | 804 US$ |
| 1990 | 1.559 US$ | 804 US$ |
| 1989 | 1.342 US$ | 792 US$ |
| 1988 | 1.164 US$ | 722 US$ |
| 1987 | 970 US$ | 650 US$ |
| 1986 | 842 US$ | 600 US$ |
| 1985 | 774 US$ | 633 US$ |
| 1984 | 847 US$ | 665 US$ |
| 1983 | 827 US$ | 723 US$ |
| 1982 | 770 US$ | 833 US$ |
| 1981 | 748 US$ | 821 US$ |
| 1980 | 709 US$ | 767 US$ |
| 1979 | 612 US$ | 667 US$ |
| 1978 | 548 US$ | 565 US$ |
| 1977 | 462 US$ | 502 US$ |
| 1976 | 405 US$ | 449 US$ |
| 1975 | 364 US$ | 401 US$ |
| 1974 | 343 US$ | 379 US$ |
| 1973 | 278,3 US$ | 283,2 US$ |
| 1972 | 215,6 US$ | 230,1 US$ |
| 1971 | 199,7 US$ | 217,4 US$ |
| 1970 | 197,1 US$ | 200,9 US$ |
| 1969 | 191,4 US$ | 261,1 US$ |
| 1968 | 178,8 US$ | 242,2 US$ |
| 1967 | 170,7 US$ | 223,1 US$ |
| 1966 | 164,5 US$ | 213,8 US$ |
| 1965 | 140,9 US$ | 199,8 US$ |
| 1964 | 128,6 US$ | 188,2 US$ |
| 1963 | 120,7 US$ | 179,5 US$ |
| 1962 | 116,2 US$ | 166,7 US$ |
| 1961 | 109,7 US$ | 283,8 US$ |
| 1960 | 102,8 US$ | 269,5 US$ |
En 2025, el PIB per cápita fue de 8057 US$ en Tailandia y de 4171 US$ en Filipinas: 1,9 veces más alto en Tailandia. En 1960 era de 103 US$ en Tailandia y de 269 US$ en Filipinas, 2,6 veces más alto en Filipinas.
El PIB per cápita de Tailandia ha sido más alto que el de Filipinas todos los años desde 1983. A precios constantes de 2015, el PIB per cápita de Tailandia en 2025 fue 11 veces el de 1960, y el de Filipinas, 3,6 veces.
Tailandia vs Filipinas: últimos datos del PIB per cápita
Comparar el PIB per cápita de 2 países cualesquiera
Fuentes:
- Banco Mundial | Economía y crecimiento (1960–2025, actualizado en octubre de 2026)
Creative Commons Atribución (CC BY): puedes copiar, compartir, adaptar y reutilizar este contenido, también con fines comerciales, siempre que cites a statistics.wiki e indiques los cambios que hayas hecho. Las fuentes indicadas arriba pueden tener sus propias condiciones de licencia.