
Sudáfrica vs República Democrática del Congo: PIB per cápita, 1960–2025
| Año | PIB per cápita, US$ corrientes | |
|---|---|---|
 Sudáfrica |
 RDC |
|
| 2025 | 6.598 US$ | 807 US$ |
| 2024 | 6.267 US$ | 693 US$ |
| 2023 | 6.034 US$ | 660 US$ |
| 2022 | 6.534 US$ | 688 US$ |
| 2021 | 6.829 US$ | 596 US$ |
| 2020 | 5.581 US$ | 486 US$ |
| 2019 | 6.534 US$ | 504 US$ |
| 2018 | 6.914 US$ | 518 US$ |
| 2017 | 6.618 US$ | 431 US$ |
| 2016 | 5.651 US$ | 460 US$ |
| 2015 | 6.112 US$ | 496 US$ |
| 2014 | 6.857 US$ | 489 US$ |
| 2013 | 7.332 US$ | 460 US$ |
| 2012 | 8.077 US$ | 410 US$ |
| 2011 | 8.646 US$ | 373 US$ |
| 2010 | 7.973 US$ | 352 US$ |
| 2009 | 6.375 US$ | 280,2 US$ |
| 2008 | 6.185 US$ | 353 US$ |
| 2007 | 6.592 US$ | 294,1 US$ |
| 2006 | 6.077 US$ | 255,4 US$ |
| 2005 | 5.837 US$ | 214,5 US$ |
| 2004 | 5.221 US$ | 180,7 US$ |
| 2003 | 4.062 US$ | 161,5 US$ |
| 2002 | 2.688 US$ | 162,4 US$ |
| 2001 | 2.847 US$ | 142,7 US$ |
| 2000 | 3.218 US$ | 378 US$ |
| 1999 | 3.242 US$ | 96,3 US$ |
| 1998 | 3.310 US$ | 131,5 US$ |
| 1997 | 3.700 US$ | 132,3 US$ |
| 1996 | 3.618 US$ | 127,4 US$ |
| 1995 | 3.856 US$ | 127 US$ |
| 1994 | 3.489 US$ | 136,5 US$ |
| 1993 | 3.400 US$ | 263,3 US$ |
| 1992 | 3.462 US$ | 209,7 US$ |
| 1991 | 3.243 US$ | 253,8 US$ |
| 1990 | 3.093 US$ | 254,9 US$ |
| 1989 | 2.727 US$ | 254,2 US$ |
| 1988 | 2.702 US$ | 257,7 US$ |
| 1987 | 2.586 US$ | 230,1 US$ |
| 1986 | 2.027 US$ | 250,9 US$ |
| 1985 | 1.839 US$ | 230,1 US$ |
| 1984 | 2.504 US$ | 259,8 US$ |
| 1983 | 2.938 US$ | 376 US$ |
| 1982 | 2.717 US$ | 482 US$ |
| 1981 | 3.050 US$ | 456 US$ |
| 1980 | 3.029 US$ | 539 US$ |
| 1979 | 2.202 US$ | 582 US$ |
| 1978 | 1.852 US$ | 615 US$ |
| 1977 | 1.671 US$ | 509 US$ |
| 1976 | 1.559 US$ | 408 US$ |
| 1975 | 1.670 US$ | 445 US$ |
| 1974 | 1.656 US$ | 428 US$ |
| 1973 | 1.369 US$ | 361 US$ |
| 1972 | 1.038 US$ | 290,5 US$ |
| 1971 | 1.020 US$ | 270,3 US$ |
| 1970 | 952 US$ | 242,2 US$ |
| 1969 | 891 US$ | 257,1 US$ |
| 1968 | 817 US$ | 205,6 US$ |
| 1967 | 779 US$ | 183,3 US$ |
| 1966 | 722 US$ | 252,8 US$ |
| 1965 | 685 US$ | 232 US$ |
| 1964 | 646 US$ | 169,9 US$ |
| 1963 | 605 US$ | 376 US$ |
| 1962 | 563 US$ | 235,1 US$ |
| 1961 | 546 US$ | 197,1 US$ |
| 1960 | 532 US$ | 220,1 US$ |
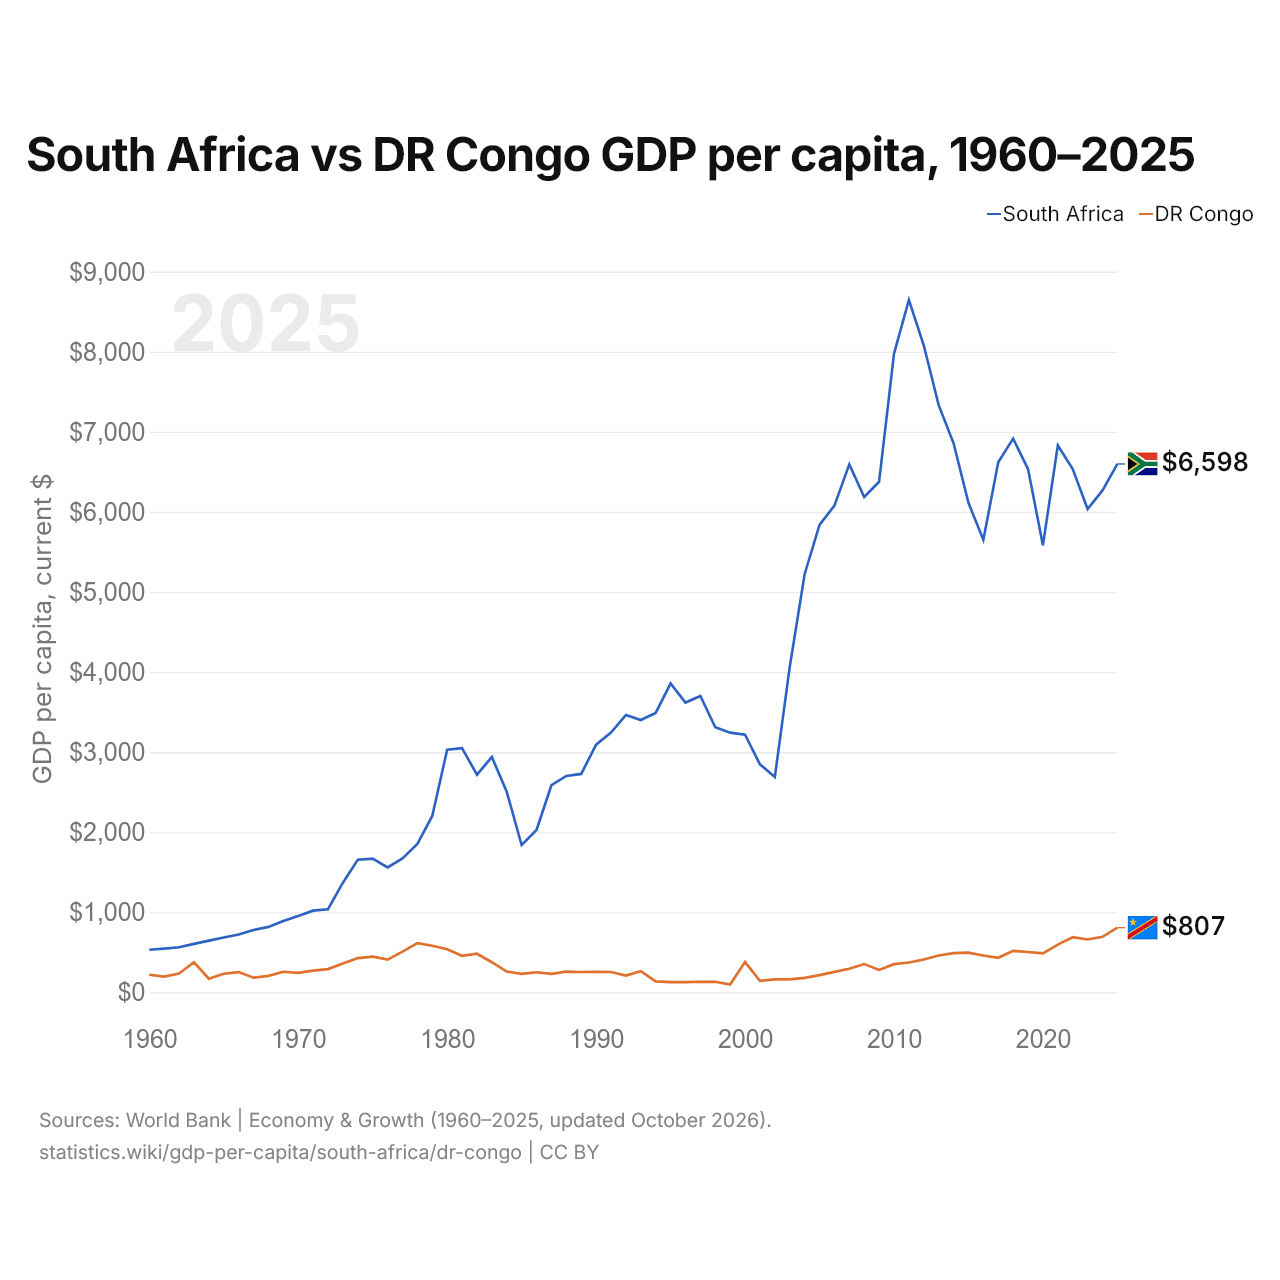
En 2025, el PIB per cápita fue de 6598 US$ en Sudáfrica y de 807 US$ en la República Democrática del Congo: 8,2 veces más alto en Sudáfrica. En 1960 era de 532 US$ en Sudáfrica y de 220 US$ en la República Democrática del Congo, 2,4 veces más alto en Sudáfrica.
El PIB per cápita de Sudáfrica ha sido más alto que el de la República Democrática del Congo todos los años desde 1960. A precios constantes de 2015, de 1960 a 2025, el PIB per cápita de Sudáfrica creció un 43 %, y el de la República Democrática del Congo cayó un 56 %.
Sudáfrica vs República Democrática del Congo: últimos datos del PIB per cápita
Comparar el PIB per cápita de 2 países cualesquiera
Fuentes:
- Banco Mundial | Economía y crecimiento (1960–2025, actualizado en octubre de 2026)
Creative Commons Atribución (CC BY): puedes copiar, compartir, adaptar y reutilizar este contenido, también con fines comerciales, siempre que cites a statistics.wiki e indiques los cambios que hayas hecho. Las fuentes indicadas arriba pueden tener sus propias condiciones de licencia.