
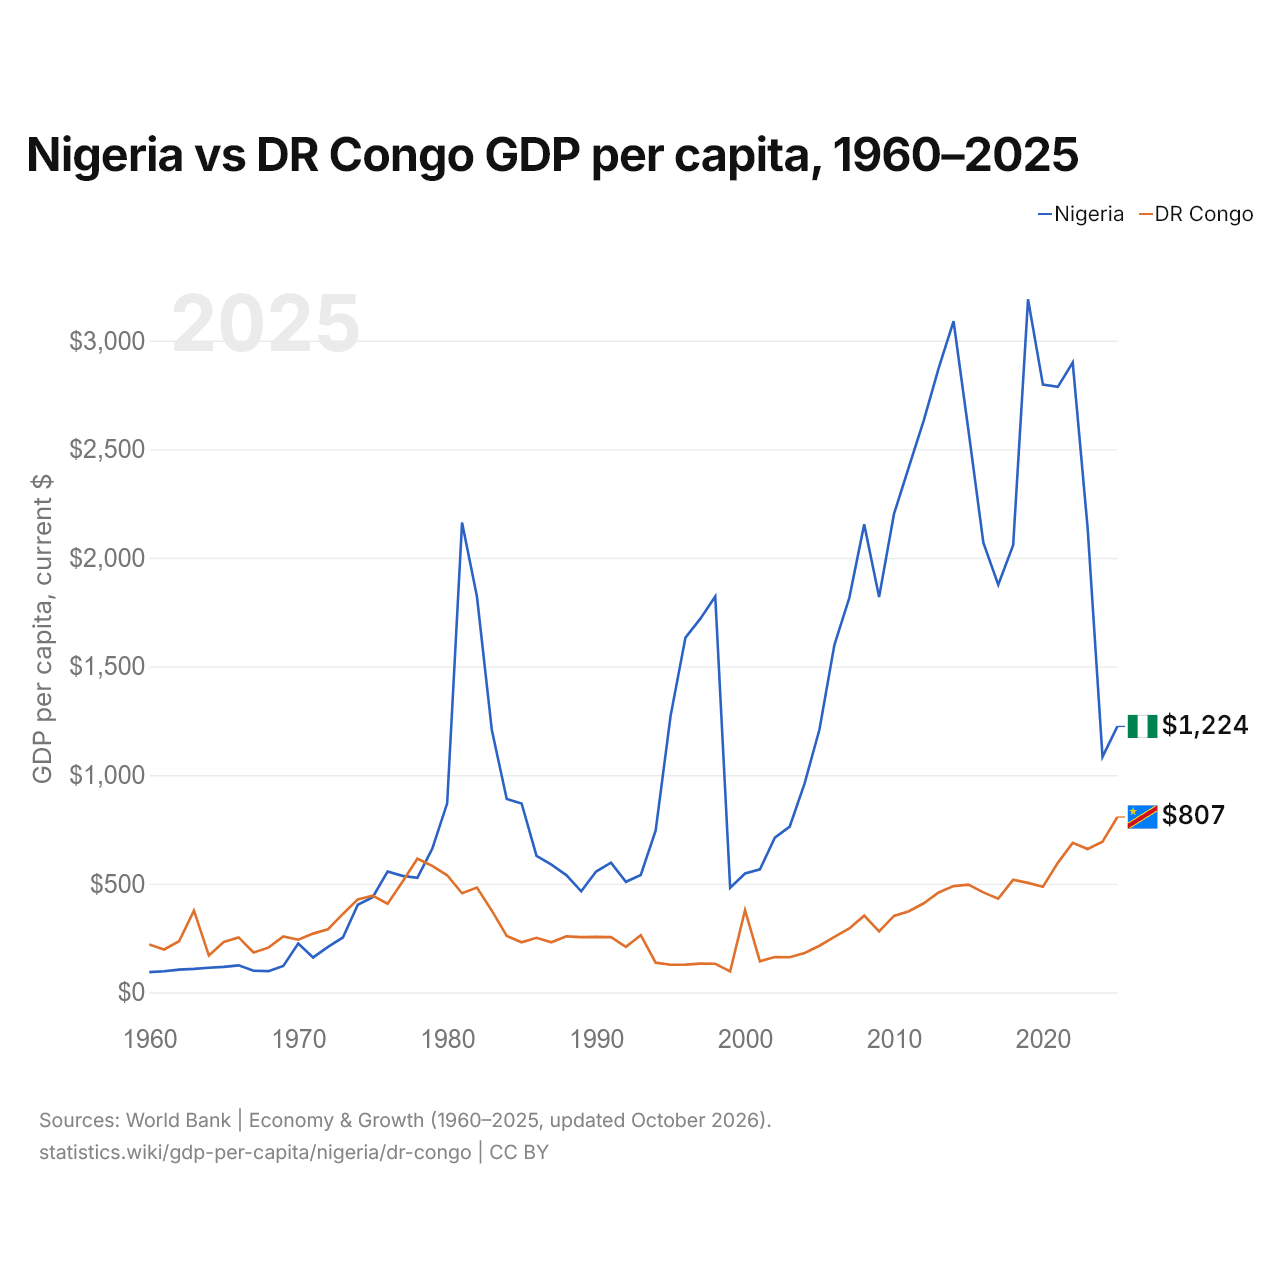
Nigeria vs República Democrática del Congo: PIB per cápita, 1960–2025
| Año | PIB per cápita, US$ corrientes | |
|---|---|---|
 Nigeria |
 RDC |
|
| 2025 | 1.224 US$ | 807 US$ |
| 2024 | 1.084 US$ | 693 US$ |
| 2023 | 2.139 US$ | 660 US$ |
| 2022 | 2.899 US$ | 688 US$ |
| 2021 | 2.787 US$ | 596 US$ |
| 2020 | 2.797 US$ | 486 US$ |
| 2019 | 3.190 US$ | 504 US$ |
| 2018 | 2.058 US$ | 518 US$ |
| 2017 | 1.876 US$ | 431 US$ |
| 2016 | 2.070 US$ | 460 US$ |
| 2015 | 2.586 US$ | 496 US$ |
| 2014 | 3.089 US$ | 489 US$ |
| 2013 | 2.873 US$ | 460 US$ |
| 2012 | 2.633 US$ | 410 US$ |
| 2011 | 2.418 US$ | 373 US$ |
| 2010 | 2.202 US$ | 352 US$ |
| 2009 | 1.820 US$ | 280,2 US$ |
| 2008 | 2.154 US$ | 353 US$ |
| 2007 | 1.816 US$ | 294,1 US$ |
| 2006 | 1.600 US$ | 255,4 US$ |
| 2005 | 1.211 US$ | 214,5 US$ |
| 2004 | 962 US$ | 180,7 US$ |
| 2003 | 763 US$ | 161,5 US$ |
| 2002 | 712 US$ | 162,4 US$ |
| 2001 | 566 US$ | 142,7 US$ |
| 2000 | 547 US$ | 378 US$ |
| 1999 | 481 US$ | 96,3 US$ |
| 1998 | 1.822 US$ | 131,5 US$ |
| 1997 | 1.720 US$ | 132,3 US$ |
| 1996 | 1.633 US$ | 127,4 US$ |
| 1995 | 1.272 US$ | 127 US$ |
| 1994 | 745 US$ | 136,5 US$ |
| 1993 | 540 US$ | 263,3 US$ |
| 1992 | 509 US$ | 209,7 US$ |
| 1991 | 597 US$ | 253,8 US$ |
| 1990 | 556 US$ | 254,9 US$ |
| 1989 | 465 US$ | 254,2 US$ |
| 1988 | 540 US$ | 257,7 US$ |
| 1987 | 588 US$ | 230,1 US$ |
| 1986 | 628 US$ | 250,9 US$ |
| 1985 | 869 US$ | 230,1 US$ |
| 1984 | 890 US$ | 259,8 US$ |
| 1983 | 1.207 US$ | 376 US$ |
| 1982 | 1.822 US$ | 482 US$ |
| 1981 | 2.162 US$ | 456 US$ |
| 1980 | 870 US$ | 539 US$ |
| 1979 | 661 US$ | 582 US$ |
| 1978 | 527 US$ | 615 US$ |
| 1977 | 536 US$ | 509 US$ |
| 1976 | 556 US$ | 408 US$ |
| 1975 | 438 US$ | 445 US$ |
| 1974 | 403 US$ | 428 US$ |
| 1973 | 252,4 US$ | 361 US$ |
| 1972 | 209,5 US$ | 290,5 US$ |
| 1971 | 160,5 US$ | 270,3 US$ |
| 1970 | 224,5 US$ | 242,2 US$ |
| 1969 | 121,4 US$ | 257,1 US$ |
| 1968 | 97,3 US$ | 205,6 US$ |
| 1967 | 99,5 US$ | 183,3 US$ |
| 1966 | 124,4 US$ | 252,8 US$ |
| 1965 | 117,3 US$ | 232 US$ |
| 1964 | 113,3 US$ | 169,9 US$ |
| 1963 | 107,7 US$ | 376 US$ |
| 1962 | 104,5 US$ | 235,1 US$ |
| 1961 | 97,1 US$ | 197,1 US$ |
| 1960 | 93,1 US$ | 220,1 US$ |
En 2025, el PIB per cápita fue de 1224 US$ en Nigeria y de 807 US$ en la República Democrática del Congo: 1,5 veces más alto en Nigeria. En 1960 era de 93 US$ en Nigeria y de 220 US$ en la República Democrática del Congo, 2,4 veces más alto en la República Democrática del Congo.
El PIB per cápita de Nigeria ha sido más alto que el de la República Democrática del Congo todos los años desde 1979. A precios constantes de 2015, de 1960 a 2025, el PIB per cápita de Nigeria creció un 63 %, y el de la República Democrática del Congo cayó un 56 %.
Nigeria vs República Democrática del Congo: últimos datos del PIB per cápita
Comparar el PIB per cápita de 2 países cualesquiera
Fuentes:
- Banco Mundial | Economía y crecimiento (1960–2025, actualizado en octubre de 2026)
Creative Commons Atribución (CC BY): puedes copiar, compartir, adaptar y reutilizar este contenido, también con fines comerciales, siempre que cites a statistics.wiki e indiques los cambios que hayas hecho. Las fuentes indicadas arriba pueden tener sus propias condiciones de licencia.