
Perú vs Paraguay: PIB per cápita, 1960–2025
| Año | PIB per cápita, US$ corrientes | |
|---|---|---|
 Perú |
 Paraguay |
|
| 2025 | 9.684 US$ | 7.027 US$ |
| 2024 | 8.526 US$ | 6.457 US$ |
| 2023 | 7.919 US$ | 6.303 US$ |
| 2022 | 7.354 US$ | 6.189 US$ |
| 2021 | 6.829 US$ | 5.975 US$ |
| 2020 | 6.133 US$ | 5.365 US$ |
| 2019 | 7.037 US$ | 5.821 US$ |
| 2018 | 6.978 US$ | 6.258 US$ |
| 2017 | 6.736 US$ | 6.152 US$ |
| 2016 | 6.217 US$ | 5.775 US$ |
| 2015 | 6.232 US$ | 5.879 US$ |
| 2014 | 6.667 US$ | 6.652 US$ |
| 2013 | 6.747 US$ | 6.436 US$ |
| 2012 | 6.519 US$ | 5.642 US$ |
| 2011 | 5.861 US$ | 5.805 US$ |
| 2010 | 5.072 US$ | 4.751 US$ |
| 2009 | 4.181 US$ | 3.942 US$ |
| 2008 | 4.198 US$ | 4.385 US$ |
| 2007 | 3.581 US$ | 3.212 US$ |
| 2006 | 3.130 US$ | 2.439 US$ |
| 2005 | 2.707 US$ | 1.971 US$ |
| 2004 | 2.397 US$ | 1.786 US$ |
| 2003 | 2.129 US$ | 1.444 US$ |
| 2002 | 2.007 US$ | 1.368 US$ |
| 2001 | 1.930 US$ | 1.638 US$ |
| 2000 | 1.945 US$ | 1.736 US$ |
| 1999 | 1.917 US$ | 1.766 US$ |
| 1998 | 2.156 US$ | 1.890 US$ |
| 1997 | 2.301 US$ | 2.079 US$ |
| 1996 | 2.227 US$ | 2.088 US$ |
| 1995 | 2.190 US$ | 1.979 US$ |
| 1994 | 1.879 US$ | 1.760 US$ |
| 1993 | 1.488 US$ | 1.662 US$ |
| 1992 | 1.567 US$ | 1.683 US$ |
| 1991 | 1.527 US$ | 1.685 US$ |
| 1990 | 1.200 US$ | 1.440 US$ |
| 1989 | 1.045 US$ | 1.211 US$ |
| 1988 | 733 US$ | 1.114 US$ |
| 1987 | 1.792 US$ | 1.069 US$ |
| 1986 | 1.087 US$ | 1.031 US$ |
| 1985 | 767 US$ | 935 US$ |
| 1984 | 918 US$ | 1.319 US$ |
| 1983 | 927 US$ | 1.710 US$ |
| 1982 | 1.194 US$ | 1.680 US$ |
| 1981 | 1.216 US$ | 1.793 US$ |
| 1980 | 1.045 US$ | 1.457 US$ |
| 1979 | 942 US$ | 1.149 US$ |
| 1978 | 756 US$ | 883 US$ |
| 1977 | 903 US$ | 740 US$ |
| 1976 | 1.026 US$ | 616 US$ |
| 1975 | 1.104 US$ | 562 US$ |
| 1974 | 927 US$ | 508 US$ |
| 1973 | 754 US$ | 389 US$ |
| 1972 | 647 US$ | 308 US$ |
| 1971 | 599 US$ | 272,1 US$ |
| 1970 | 550 US$ | 249 US$ |
| 1969 | 488 US$ | 238,2 US$ |
| 1968 | 448 US$ | 226,8 US$ |
| 1967 | 498 US$ | 220,9 US$ |
| 1966 | 505 US$ | 213,9 US$ |
| 1965 | 439 US$ | 208,7 US$ |
| 1964 | 381 US$ | 197 US$ |
| 1963 | 324 US$ | 189,9 US$ |
| 1962 | 305 US$ | 182,8 US$ |
| 1961 | 276,6 US$ | 167,1 US$ |
| 1960 | 252,8 US$ | 153,4 US$ |
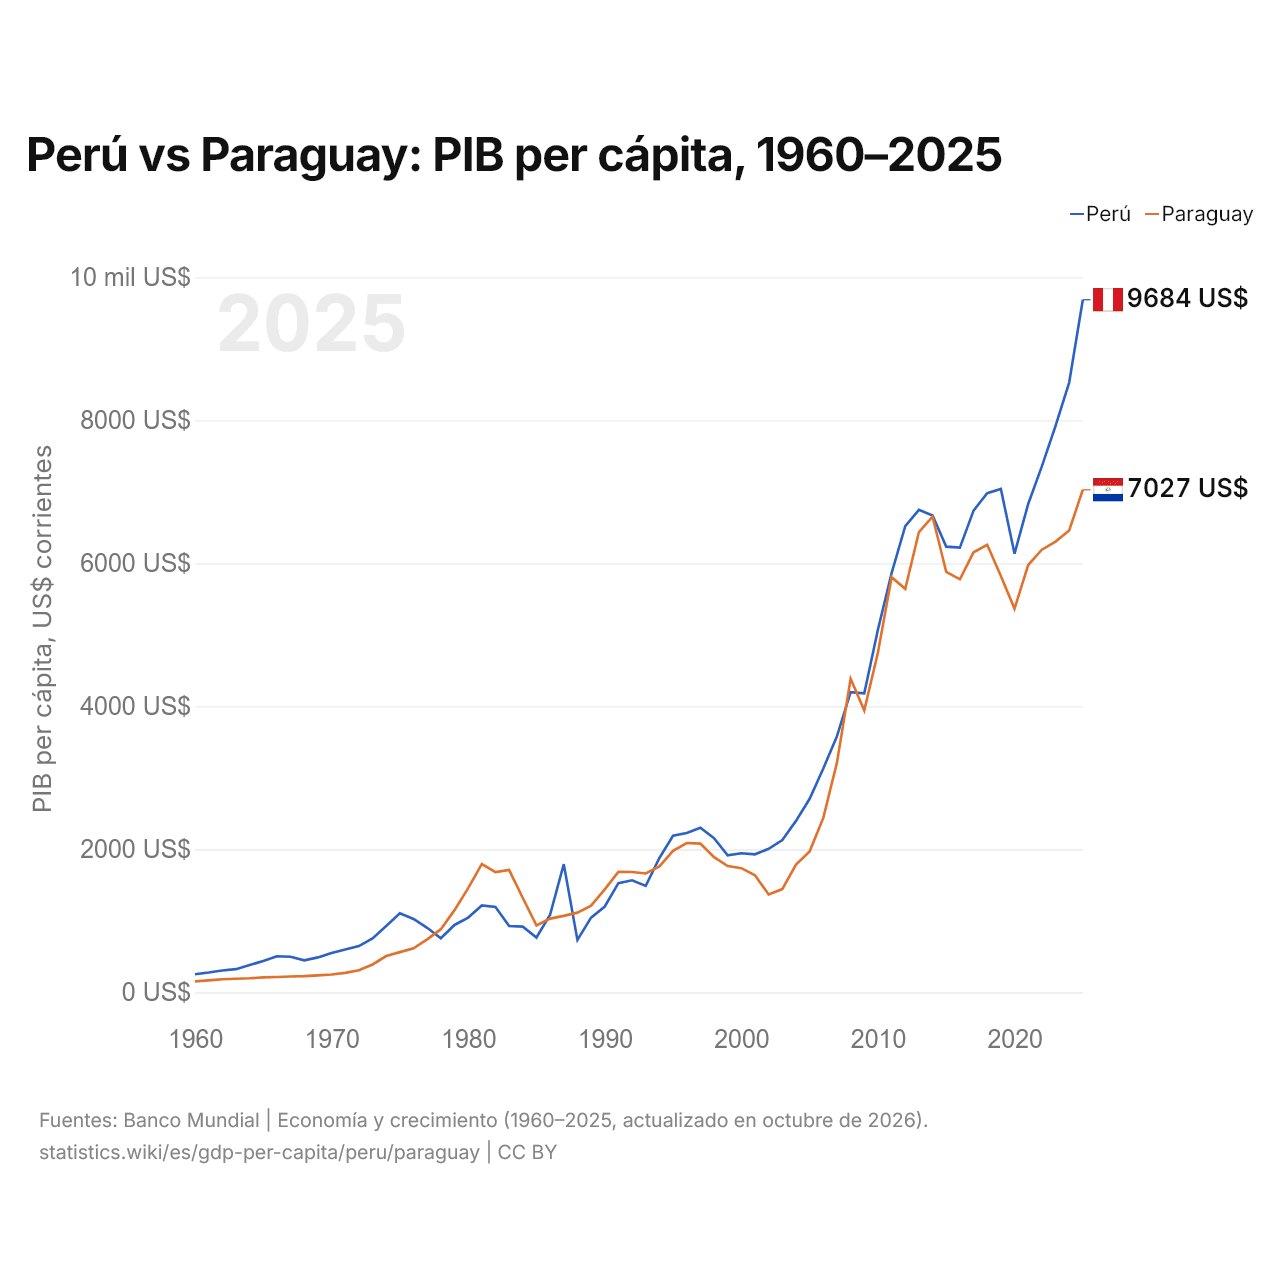
En 2025, el PIB per cápita fue de 9684 US$ en Perú y de 7027 US$ en Paraguay: un 38 % más alto en Perú. En 1960 era de 253 US$ en Perú y de 153 US$ en Paraguay, 1,6 veces más alto en Perú.
El PIB per cápita de Perú ha sido más alto que el de Paraguay todos los años desde 2009. A precios constantes de 2015, el PIB per cápita de Perú en 2025 fue 2,5 veces el de 1960, y el de Paraguay, 4,7 veces. En paridad de poder adquisitivo el orden se invierte: el PIB per cápita (PPA) es de 20.181 dólares en Paraguay y de 18.816 dólares en Perú.
Perú vs Paraguay: últimos datos del PIB per cápita
Comparar el PIB per cápita de 2 países cualesquiera
Fuentes:
- Banco Mundial | Economía y crecimiento (1960–2025, actualizado en octubre de 2026)
Creative Commons Atribución (CC BY): puedes copiar, compartir, adaptar y reutilizar este contenido, también con fines comerciales, siempre que cites a statistics.wiki e indiques los cambios que hayas hecho. Las fuentes indicadas arriba pueden tener sus propias condiciones de licencia.