
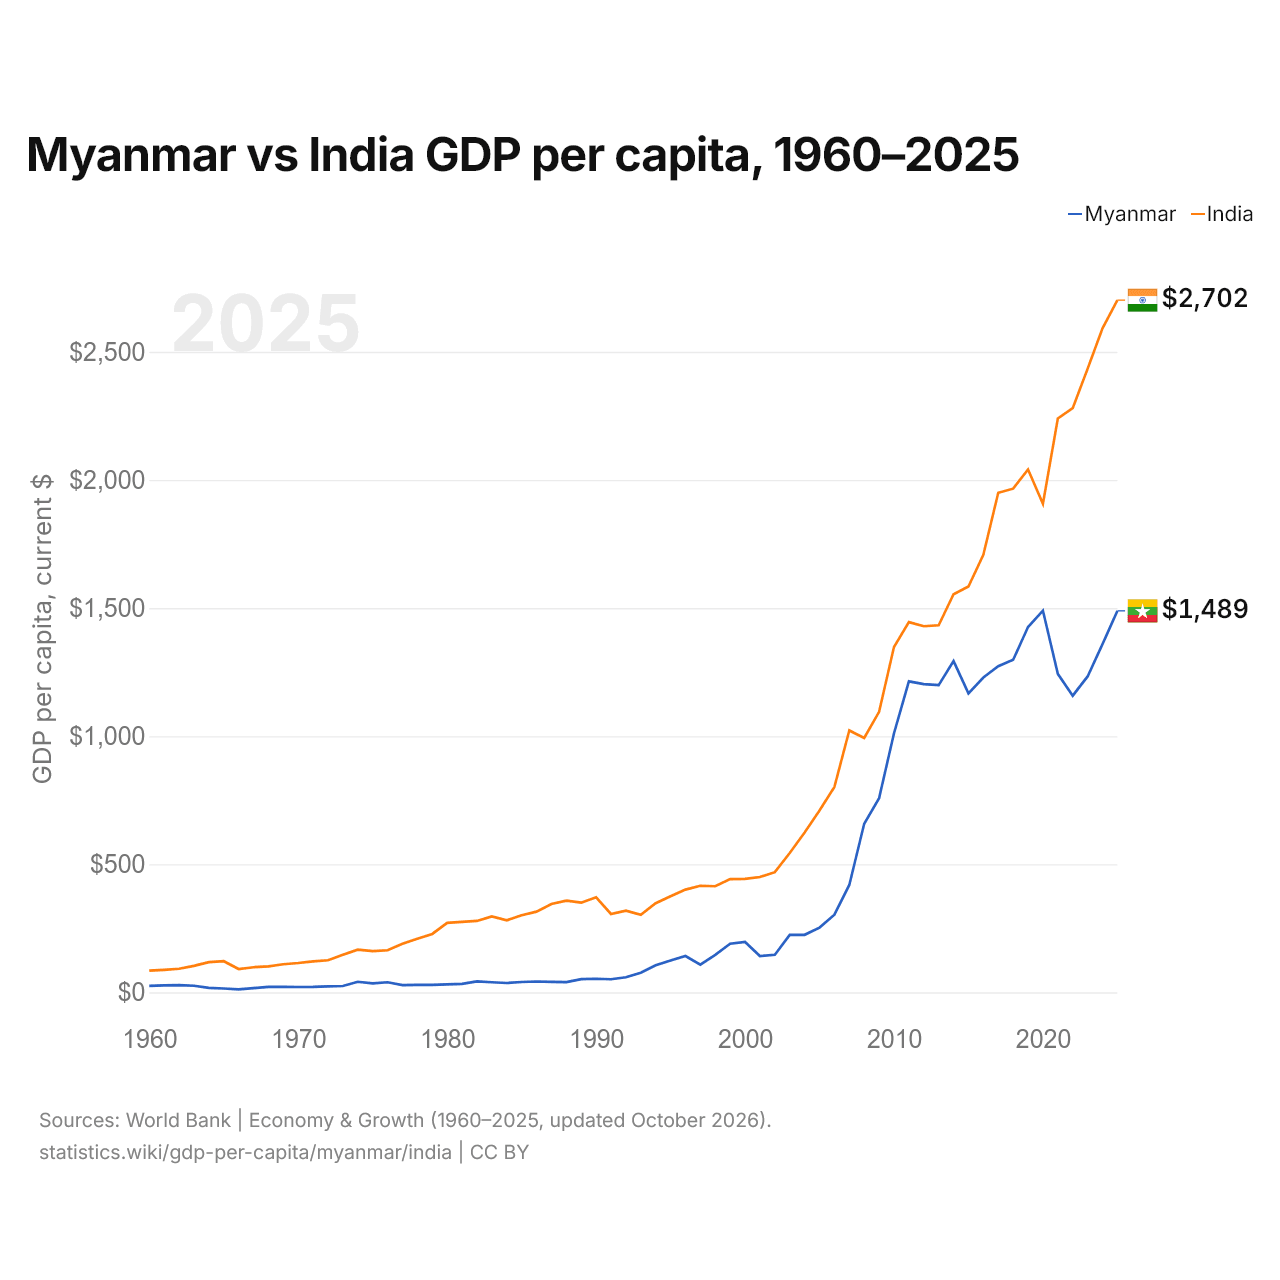
Birmania vs India: PIB per cápita, 1960–2025
| Año | PIB per cápita, US$ corrientes | |
|---|---|---|
 Birmania |
 India |
|
| 2025 | 1.489 US$ | 2.702 US$ |
| 2024 | 1.359 US$ | 2.592 US$ |
| 2023 | 1.233 US$ | 2.434 US$ |
| 2022 | 1.158 US$ | 2.280 US$ |
| 2021 | 1.243 US$ | 2.240 US$ |
| 2020 | 1.490 US$ | 1.907 US$ |
| 2019 | 1.426 US$ | 2.041 US$ |
| 2018 | 1.298 US$ | 1.966 US$ |
| 2017 | 1.273 US$ | 1.950 US$ |
| 2016 | 1.229 US$ | 1.708 US$ |
| 2015 | 1.167 US$ | 1.584 US$ |
| 2014 | 1.293 US$ | 1.554 US$ |
| 2013 | 1.199 US$ | 1.433 US$ |
| 2012 | 1.203 US$ | 1.429 US$ |
| 2011 | 1.214 US$ | 1.445 US$ |
| 2010 | 1.011 US$ | 1.348 US$ |
| 2009 | 758 US$ | 1.095 US$ |
| 2008 | 658 US$ | 993 US$ |
| 2007 | 419 US$ | 1.022 US$ |
| 2006 | 303 US$ | 802 US$ |
| 2005 | 252,7 US$ | 710 US$ |
| 2004 | 224,5 US$ | 624 US$ |
| 2003 | 224,3 US$ | 544 US$ |
| 2002 | 146,6 US$ | 469 US$ |
| 2001 | 141,5 US$ | 450 US$ |
| 2000 | 196,6 US$ | 443 US$ |
| 1999 | 189,5 US$ | 442 US$ |
| 1998 | 146 US$ | 414 US$ |
| 1997 | 108 US$ | 416 US$ |
| 1996 | 141,9 US$ | 401 US$ |
| 1995 | 124,1 US$ | 375 US$ |
| 1994 | 105,4 US$ | 348 US$ |
| 1993 | 76,2 US$ | 303 US$ |
| 1992 | 58,9 US$ | 319 US$ |
| 1991 | 51,2 US$ | 306 US$ |
| 1990 | 53,1 US$ | 371 US$ |
| 1989 | 51,3 US$ | 350 US$ |
| 1988 | 39,9 US$ | 358 US$ |
| 1987 | 41,1 US$ | 345 US$ |
| 1986 | 42,4 US$ | 315 US$ |
| 1985 | 40,4 US$ | 301 US$ |
| 1984 | 36,3 US$ | 281 US$ |
| 1983 | 39,3 US$ | 296 US$ |
| 1982 | 43 US$ | 278,7 US$ |
| 1981 | 32,8 US$ | 275 US$ |
| 1980 | 31,2 US$ | 271,1 US$ |
| 1979 | 29,2 US$ | 228 US$ |
| 1978 | 29,3 US$ | 209,4 US$ |
| 1977 | 27,9 US$ | 189,6 US$ |
| 1976 | 39,2 US$ | 164,1 US$ |
| 1975 | 35,2 US$ | 161,1 US$ |
| 1974 | 41,4 US$ | 166,7 US$ |
| 1973 | 24,8 US$ | 146,6 US$ |
| 1972 | 23,3 US$ | 125,3 US$ |
| 1971 | 21,1 US$ | 120,7 US$ |
| 1970 | 20,7 US$ | 114,4 US$ |
| 1969 | 21,5 US$ | 109,5 US$ |
| 1968 | 21,5 US$ | 101,6 US$ |
| 1967 | 16,5 US$ | 98 US$ |
| 1966 | 11,8 US$ | 91 US$ |
| 1965 | 15,1 US$ | 121,5 US$ |
| 1964 | 17,3 US$ | 117,9 US$ |
| 1963 | 25,8 US$ | 103,4 US$ |
| 1962 | 27,9 US$ | 92,2 US$ |
| 1961 | 27,3 US$ | 87,9 US$ |
| 1960 | 25,1 US$ | 84,9 US$ |
En 2025, el PIB per cápita fue de 1489 US$ en Birmania y de 2702 US$ en la India: 1,8 veces más alto en la India. En 1960 era de 25 US$ en Birmania y de 85 US$ en la India, 3,4 veces más alto en la India.
El PIB per cápita de la India ha sido más alto que el de Birmania todos los años desde 1960. A precios constantes de 2015, el PIB per cápita de Birmania en 2025 fue 8,7 veces el de 1960, y el de la India, 8,1 veces.
Birmania vs India: últimos datos del PIB per cápita
Comparar el PIB per cápita de 2 países cualesquiera
Fuentes:
- Banco Mundial | Economía y crecimiento (1960–2025, actualizado en octubre de 2026)
Creative Commons Atribución (CC BY): puedes copiar, compartir, adaptar y reutilizar este contenido, también con fines comerciales, siempre que cites a statistics.wiki e indiques los cambios que hayas hecho. Las fuentes indicadas arriba pueden tener sus propias condiciones de licencia.