
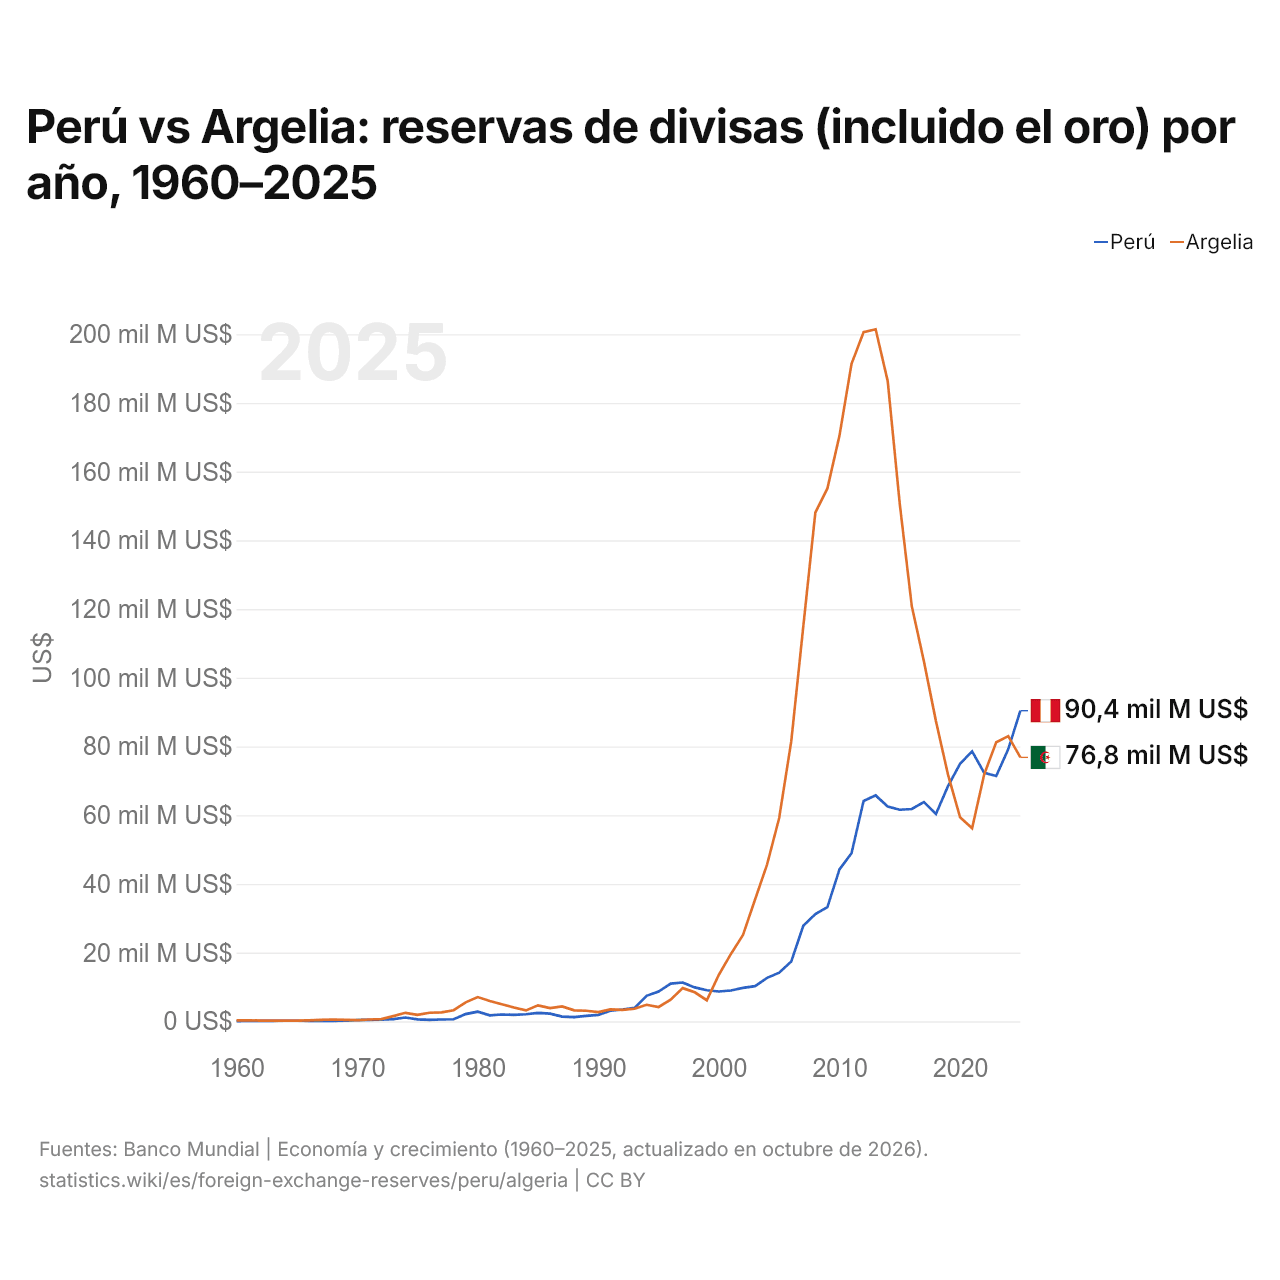
Perú vs Argelia: reservas de divisas (incluido el oro) por año, 1960–2025
1x
| Año | US$ | |
|---|---|---|
 Perú |
 Argelia |
|
| 2025 | 90.393.720.332 US$ | 76.825.229.206 US$ |
| 2024 | 79.246.042.708 US$ | 83.007.108.429 US$ |
| 2023 | 71.394.387.240 US$ | 81.216.738.412 US$ |
| 2022 | 72.328.123.071 US$ | 71.852.290.094 US$ |
| 2021 | 78.589.897.923 US$ | 56.211.005.199 US$ |
| 2020 | 74.961.659.711 US$ | 59.434.389.110 US$ |
| 2019 | 68.440.494.635 US$ | 71.795.950.715 US$ |
| 2018 | 60.333.192.028 US$ | 87.382.910.154 US$ |
| 2017 | 63.819.289.823 US$ | 104.852.543.743 US$ |
| 2016 | 61.801.163.826 US$ | 120.788.088.861 US$ |
| 2015 | 61.594.854.518 US$ | 150.595.236.895 US$ |
| 2014 | 62.529.703.139 US$ | 186.350.590.141 US$ |
| 2013 | 65.766.057.258 US$ | 201.436.604.412 US$ |
| 2012 | 64.155.414.234 US$ | 200.586.904.241 US$ |
| 2011 | 48.913.125.193 US$ | 191.369.111.470 US$ |
| 2010 | 44.214.818.033 US$ | 170.461.132.879 US$ |
| 2009 | 33.225.062.119 US$ | 155.111.906.772 US$ |
| 2008 | 31.241.123.023 US$ | 148.098.646.077 US$ |
| 2007 | 27.786.002.525 US$ | 114.972.269.712 US$ |
| 2006 | 17.442.093.800 US$ | 81.462.730.475 US$ |
| 2005 | 14.171.339.683 US$ | 59.167.068.864 US$ |
| 2004 | 12.664.710.327 US$ | 45.691.652.467 US$ |
| 2003 | 10.241.971.443 US$ | 35.454.600.266 US$ |
| 2002 | 9.721.160.043 US$ | 25.151.012.703 US$ |
| 2001 | 8.980.104.804 US$ | 19.625.060.613 US$ |
| 2000 | 8.675.891.764 US$ | 13.556.106.802 US$ |
| 1999 | 9.049.757.352 US$ | 6.146.079.211 US$ |
| 1998 | 9.882.068.017 US$ | 8.452.272.525 US$ |
| 1997 | 11.305.742.354 US$ | 9.666.874.795 US$ |
| 1996 | 10.989.953.426 US$ | 6.296.459.575 US$ |
| 1995 | 8.653.281.586 US$ | 4.164.319.964 US$ |
| 1994 | 7.420.192.725 US$ | 4.813.488.033 US$ |
| 1993 | 3.917.582.865 US$ | 3.655.668.338 US$ |
| 1992 | 3.456.209.000 US$ | 3.317.517.177 US$ |
| 1991 | 3.090.441.600 US$ | 3.459.969.141 US$ |
| 1990 | 1.890.650.000 US$ | 2.703.474.408 US$ |
| 1989 | 1.597.167.000 US$ | 3.085.702.760 US$ |
| 1988 | 1.213.348.000 US$ | 3.190.542.199 US$ |
| 1987 | 1.370.497.700 US$ | 4.343.099.115 US$ |
| 1986 | 2.242.553.300 US$ | 3.842.516.472 US$ |
| 1985 | 2.480.958.000 US$ | 4.644.533.024 US$ |
| 1984 | 2.061.520.793 US$ | 3.185.336.009 US$ |
| 1983 | 1.899.044.234 US$ | 4.010.232.279 US$ |
| 1982 | 1.988.396.020 US$ | 4.972.783.276 US$ |
| 1981 | 1.755.200.116 US$ | 5.914.588.650 US$ |
| 1980 | 2.803.966.994 US$ | 7.063.796.833 US$ |
| 1979 | 2.113.581.930 US$ | 5.517.255.565 US$ |
| 1978 | 616.609.532 US$ | 3.229.638.828 US$ |
| 1977 | 522.224.574 US$ | 2.590.691.196 US$ |
| 1976 | 424.499.912 US$ | 2.502.228.025 US$ |
| 1975 | 566.164.817 US$ | 1.895.709.477 US$ |
| 1974 | 1.112.278.561 US$ | 2.474.721.194 US$ |
| 1973 | 638.654.426 US$ | 1.526.311.529 US$ |
| 1972 | 513.201.370 US$ | 640.169.274 US$ |
| 1971 | 430.223.333 US$ | 537.318.204 US$ |
| 1970 | 332.057.580 US$ | 352.276.530 US$ |
| 1969 | 167.156.800 US$ | 410.627.600 US$ |
| 1968 | 115.115.400 US$ | 532.109.700 US$ |
| 1967 | 125.860.400 US$ | 442.988.000 US$ |
| 1966 | 155.236.310 US$ | 273.085.970 US$ |
| 1965 | 174.910.400 US$ | 184.224.560 US$ |
| 1964 | 160.421.120 US$ | 194.924.560 US$ |
| 1963 | 135.311.200 US$ | 237.218.040 US$ |
| 1962 | 116.734.780 US$ | 185.716.410 US$ |
| 1961 | 110.623.100 US$ | 311.729.450 US$ |
| 1960 | 76.811.600 US$ | 265.802.800 US$ |
En 2025, las reservas de divisas de Perú fueron de 90,4 mil millones de US$ y las de Argelia, de 76,8 mil millones de US$: las de Perú fueron un 18 % mayores. En 1960, las reservas de Argelia fueron 3,5 veces mayores: 76,8 millones de US$ de Perú y 266 millones de US$ de Argelia.
Perú vs Argelia: reservas, incluido el oro, y meses de importaciones cubiertos
|
Perú
|
Argelia
|
|
|---|---|---|
| Reservas, incluido el oro | 90,4 mil M US$ | 76,8 mil M US$ |
| Meses de importaciones | 14,8 | 14,5 |
| Puesto mundial | 32/168 | 35/168 |
| Diferencia de reservas | 1,2× | 0,85× |
Comparar las reservas de divisas de 2 países cualesquiera
Fuentes:
- Banco Mundial | Economía y crecimiento (1960–2025, actualizado en octubre de 2026)
Creative Commons Atribución (CC BY): puedes copiar, compartir, adaptar y reutilizar este contenido, también con fines comerciales, siempre que cites a statistics.wiki e indiques los cambios que hayas hecho. Las fuentes indicadas arriba pueden tener sus propias condiciones de licencia.