
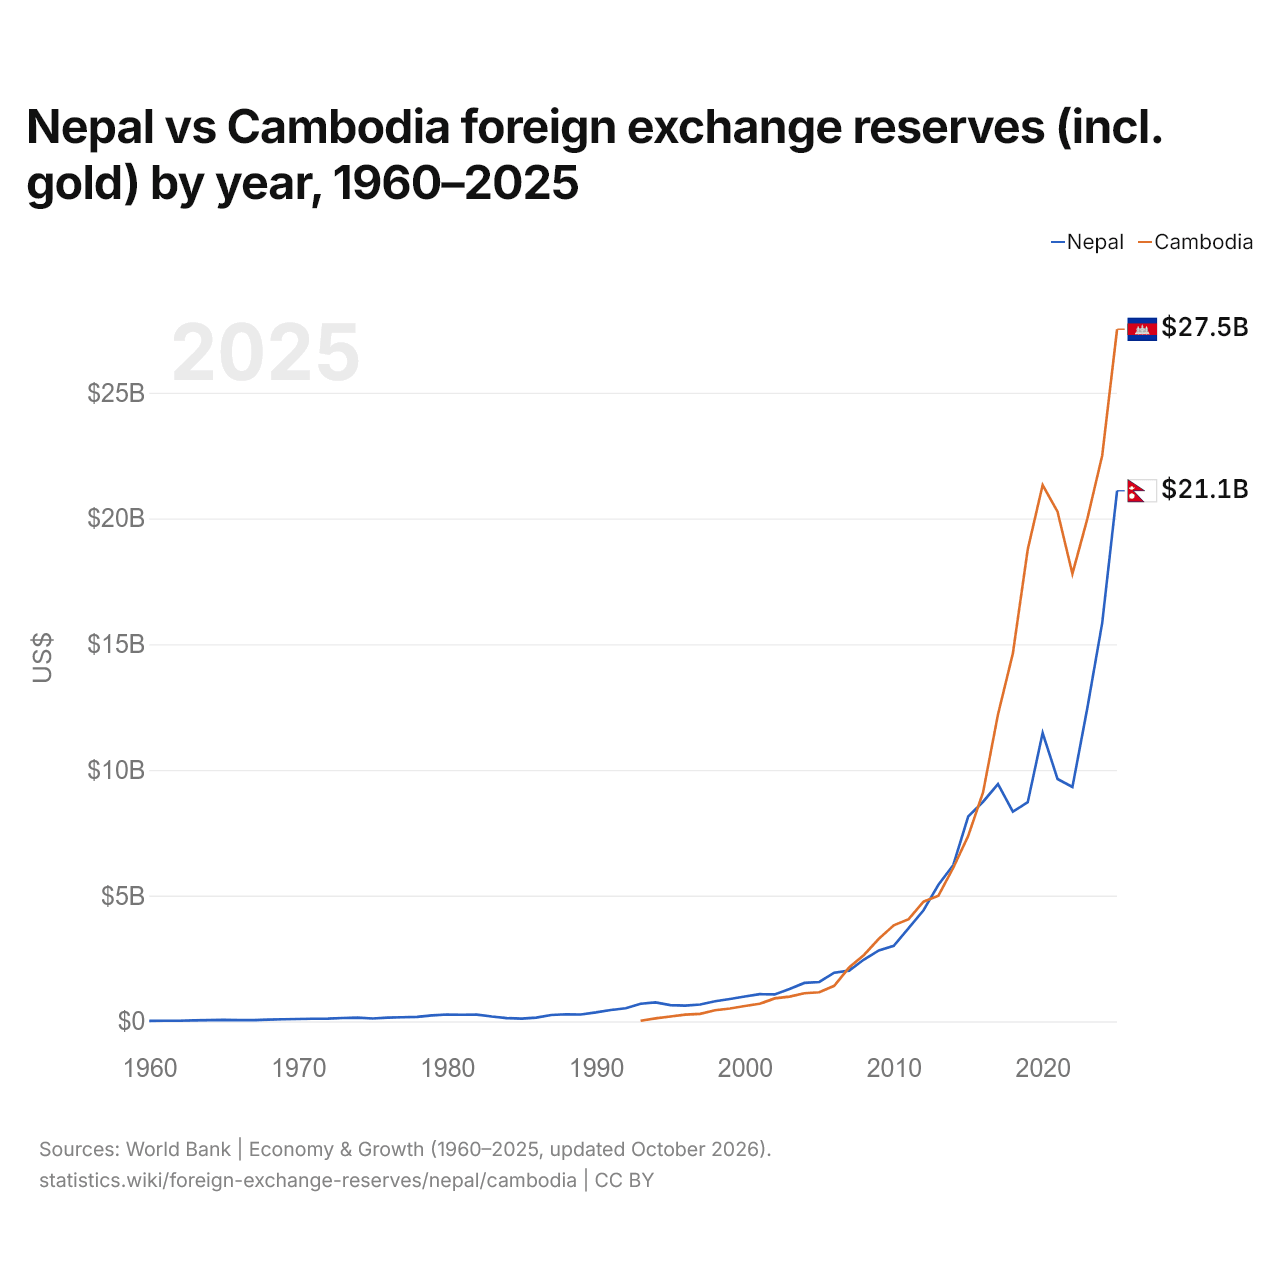
Nepal vs Camboya: reservas de divisas (incluido el oro) por año, 1960–2025
1x
| Año | US$ | |
|---|---|---|
 Nepal |
 Camboya |
|
| 2025 | 21.100.332.322 US$ | 27.524.430.821 US$ |
| 2024 | 15.846.781.299 US$ | 22.505.568.573 US$ |
| 2023 | 12.456.122.669 US$ | 19.983.916.475 US$ |
| 2022 | 9.319.150.273 US$ | 17.801.364.792 US$ |
| 2021 | 9.638.842.484 US$ | 20.269.721.098 US$ |
| 2020 | 11.467.799.302 US$ | 21.328.475.093 US$ |
| 2019 | 8.713.166.195 US$ | 18.771.430.900 US$ |
| 2018 | 8.335.473.017 US$ | 14.630.894.026 US$ |
| 2017 | 9.435.255.967 US$ | 12.201.741.896 US$ |
| 2016 | 8.734.510.299 US$ | 9.113.957.299 US$ |
| 2015 | 8.145.463.908 US$ | 7.375.682.885 US$ |
| 2014 | 6.216.255.070 US$ | 6.108.231.224 US$ |
| 2013 | 5.434.181.403 US$ | 4.997.891.277 US$ |
| 2012 | 4.417.738.496 US$ | 4.759.658.458 US$ |
| 2011 | 3.702.502.162 US$ | 4.061.810.700 US$ |
| 2010 | 3.002.724.838 US$ | 3.817.077.827 US$ |
| 2009 | 2.819.466.154 US$ | 3.285.950.772 US$ |
| 2008 | 2.457.914.115 US$ | 2.639.301.421 US$ |
| 2007 | 2.014.032.856 US$ | 2.140.273.311 US$ |
| 2006 | 1.935.487.673 US$ | 1.411.426.995 US$ |
| 2005 | 1.565.203.520 US$ | 1.158.091.689 US$ |
| 2004 | 1.529.099.986 US$ | 1.118.336.324 US$ |
| 2003 | 1.286.240.900 US$ | 982.362.875 US$ |
| 2002 | 1.070.003.807 US$ | 913.189.871 US$ |
| 2001 | 1.079.959.914 US$ | 697.362.970 US$ |
| 2000 | 987.342.047 US$ | 611.415.268 US$ |
| 1999 | 889.429.673 US$ | 509.239.611 US$ |
| 1998 | 800.272.085 US$ | 439.450.908 US$ |
| 1997 | 670.587.740 US$ | 298.634.409 US$ |
| 1996 | 627.771.666 US$ | 265.780.085 US$ |
| 1995 | 645.536.746 US$ | 191.983.700 US$ |
| 1994 | 752.158.919 US$ | 118.495.163 US$ |
| 1993 | 699.898.113 US$ | 24.181.917 US$ |
| 1992 | 518.336.214 US$ | - |
| 1991 | 450.982.960 US$ | - |
| 1990 | 354.107.095 US$ | - |
| 1989 | 272.846.716 US$ | - |
| 1988 | 282.826.478 US$ | - |
| 1987 | 251.413.397 US$ | - |
| 1986 | 145.886.829 US$ | - |
| 1985 | 105.467.402 US$ | - |
| 1984 | 128.600.058 US$ | - |
| 1983 | 191.064.674 US$ | - |
| 1982 | 268.378.934 US$ | - |
| 1981 | 262.066.242 US$ | - |
| 1980 | 271.948.974 US$ | - |
| 1979 | 235.268.995 US$ | - |
| 1978 | 178.077.054 US$ | - |
| 1977 | 161.385.891 US$ | - |
| 1976 | 145.042.574 US$ | - |
| 1975 | 113.974.569 US$ | - |
| 1974 | 145.577.564 US$ | - |
| 1973 | 132.121.707 US$ | - |
| 1972 | 107.173.202 US$ | - |
| 1971 | 102.268.065 US$ | - |
| 1970 | 94.202.508 US$ | - |
| 1969 | 83.753.427 US$ | - |
| 1968 | 65.316.280 US$ | - |
| 1967 | 46.384.506 US$ | - |
| 1966 | 44.983.567 US$ | - |
| 1965 | 59.519.654 US$ | - |
| 1964 | 49.119.654 US$ | - |
| 1963 | 36.256.170 US$ | - |
| 1962 | 24.045.769 US$ | - |
| 1961 | 24.149.980 US$ | - |
| 1960 | 19.273.664 US$ | - |
En 2025, las reservas de divisas de Nepal fueron de 21,1 mil millones de US$ y las de Camboya, de 27,5 mil millones de US$: las de Camboya fueron un 30 % mayores. En 1993, las reservas de Nepal fueron 29 veces mayores: 700 millones de US$ de Nepal y 24,2 millones de US$ de Camboya.
Las reservas de divisas de Camboya han sido mayores que las de Nepal todos los años desde 2016.
Nepal vs Camboya: reservas, incluido el oro, y meses de importaciones cubiertos
|
Nepal
|
Camboya
|
|
|---|---|---|
| Reservas, incluido el oro | 21,1 mil M US$ | 27,5 mil M US$ |
| Meses de importaciones | 16,5 | 9,6 |
| Puesto mundial | 65/168 | 60/168 |
| Diferencia de reservas | 0,77× | 1,3× |
Comparar las reservas de divisas de 2 países cualesquiera
Fuentes:
- Banco Mundial | Economía y crecimiento (1960–2025, actualizado en octubre de 2026)
Creative Commons Atribución (CC BY): puedes copiar, compartir, adaptar y reutilizar este contenido, también con fines comerciales, siempre que cites a statistics.wiki e indiques los cambios que hayas hecho. Las fuentes indicadas arriba pueden tener sus propias condiciones de licencia.