
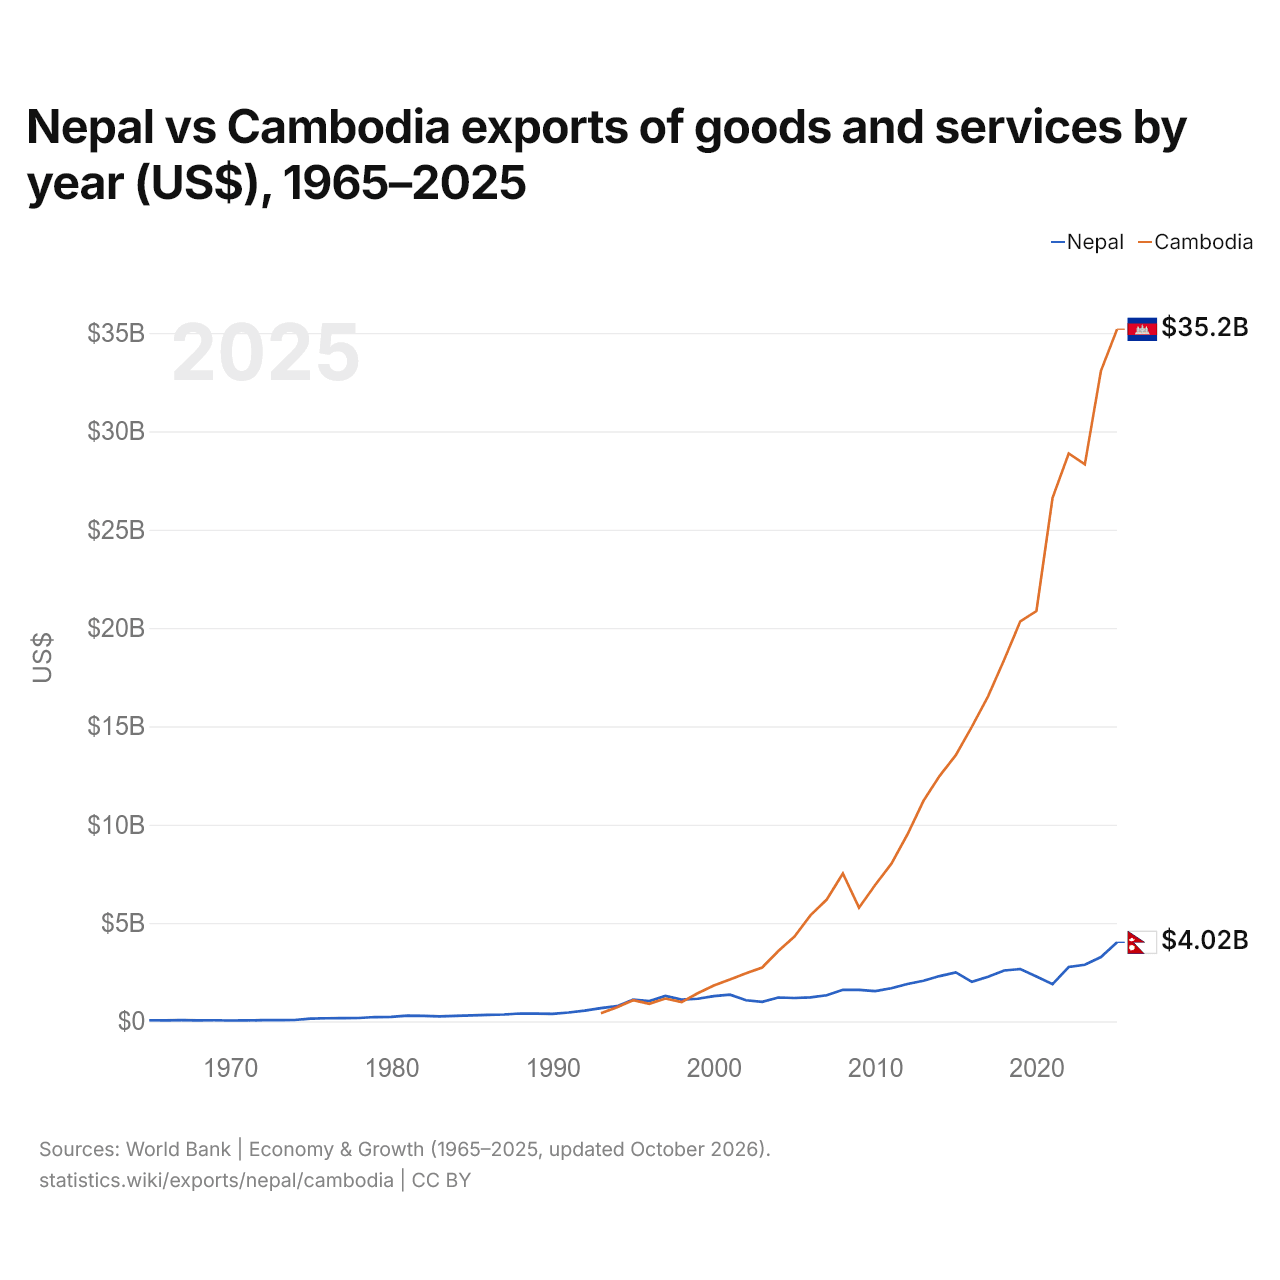
Nepal vs Camboya: exportaciones de bienes y servicios por año (US$), 1965–2025
| Año | US$ | |
|---|---|---|
 Nepal |
 Camboya |
|
| 2025 | 4.015.673.777 US$ | 35.193.057.307 US$ |
| 2024 | 3.270.900.881 US$ | 33.078.910.281 US$ |
| 2023 | 2.875.902.618 US$ | 28.319.442.900 US$ |
| 2022 | 2.760.241.576 US$ | 28.878.876.682 US$ |
| 2021 | 1.890.245.951 US$ | 26.621.743.091 US$ |
| 2020 | 2.275.260.267 US$ | 20.863.615.890 US$ |
| 2019 | 2.659.663.141 US$ | 20.340.881.133 US$ |
| 2018 | 2.587.877.950 US$ | 18.386.489.552 US$ |
| 2017 | 2.263.315.185 US$ | 16.527.255.663 US$ |
| 2016 | 2.005.968.674 US$ | 14.986.346.465 US$ |
| 2015 | 2.488.355.629 US$ | 13.532.995.573 US$ |
| 2014 | 2.301.358.066 US$ | 12.481.981.424 US$ |
| 2013 | 2.059.901.303 US$ | 11.214.912.044 US$ |
| 2012 | 1.899.084.545 US$ | 9.498.870.542 US$ |
| 2011 | 1.684.085.753 US$ | 8.003.673.661 US$ |
| 2010 | 1.533.460.341 US$ | 6.935.619.207 US$ |
| 2009 | 1.596.506.175 US$ | 5.777.715.035 US$ |
| 2008 | 1.602.782.687 US$ | 7.521.137.176 US$ |
| 2007 | 1.327.426.849 US$ | 6.191.862.457 US$ |
| 2006 | 1.216.071.411 US$ | 5.400.482.920 US$ |
| 2005 | 1.185.691.417 US$ | 4.313.261.451 US$ |
| 2004 | 1.213.488.963 US$ | 3.578.124.692 US$ |
| 2003 | 993.875.698 US$ | 2.736.752.435 US$ |
| 2002 | 1.073.251.679 US$ | 2.439.168.009 US$ |
| 2001 | 1.355.238.095 US$ | 2.121.742.524 US$ |
| 2000 | 1.279.281.888 US$ | 1.821.406.331 US$ |
| 1999 | 1.150.110.375 US$ | 1.426.037.338 US$ |
| 1998 | 1.108.297.014 US$ | 974.763.068 US$ |
| 1997 | 1.294.985.096 US$ | 1.157.570.060 US$ |
| 1996 | 1.031.715.001 US$ | 889.438.539 US$ |
| 1995 | 1.099.094.803 US$ | 1.073.111.830 US$ |
| 1994 | 772.440.816 US$ | 719.965.852 US$ |
| 1993 | 674.654.167 US$ | 406.842.505 US$ |
| 1992 | 542.824.053 US$ | - |
| 1991 | 450.607.064 US$ | - |
| 1990 | 381.884.480 US$ | - |
| 1989 | 390.158.053 US$ | - |
| 1988 | 399.163.908 US$ | - |
| 1987 | 349.348.713 US$ | - |
| 1986 | 332.466.752 US$ | - |
| 1985 | 302.055.496 US$ | - |
| 1984 | 274.961.829 US$ | - |
| 1983 | 250.371.505 US$ | - |
| 1982 | 277.667.558 US$ | - |
| 1981 | 293.583.342 US$ | - |
| 1980 | 224.583.342 US$ | - |
| 1979 | 218.166.658 US$ | - |
| 1978 | 169.586.602 US$ | - |
| 1977 | 162.959.992 US$ | - |
| 1976 | 156.521.017 US$ | - |
| 1975 | 140.262.467 US$ | - |
| 1974 | 66.375.048 US$ | - |
| 1973 | 64.260.709 US$ | - |
| 1972 | 57.975.286 US$ | - |
| 1971 | 47.703.704 US$ | - |
| 1970 | 42.469.136 US$ | - |
| 1969 | 55.308.642 US$ | - |
| 1968 | 52.860.114 US$ | - |
| 1967 | 57.881.612 US$ | - |
| 1966 | 51.187.820 US$ | - |
| 1965 | 57.094.107 US$ | - |
En 2025, las exportaciones de bienes y servicios de Nepal fueron de 4,02 mil millones de US$ y las de Camboya, de 35,2 mil millones de US$: las de Camboya fueron 8,8 veces mayores. En 1993, las exportaciones de Nepal fueron 1,7 veces mayores: 675 millones de US$ de Nepal y 407 millones de US$ de Camboya.
Las exportaciones de bienes y servicios de Camboya han sido mayores que las de Nepal todos los años desde 1999.
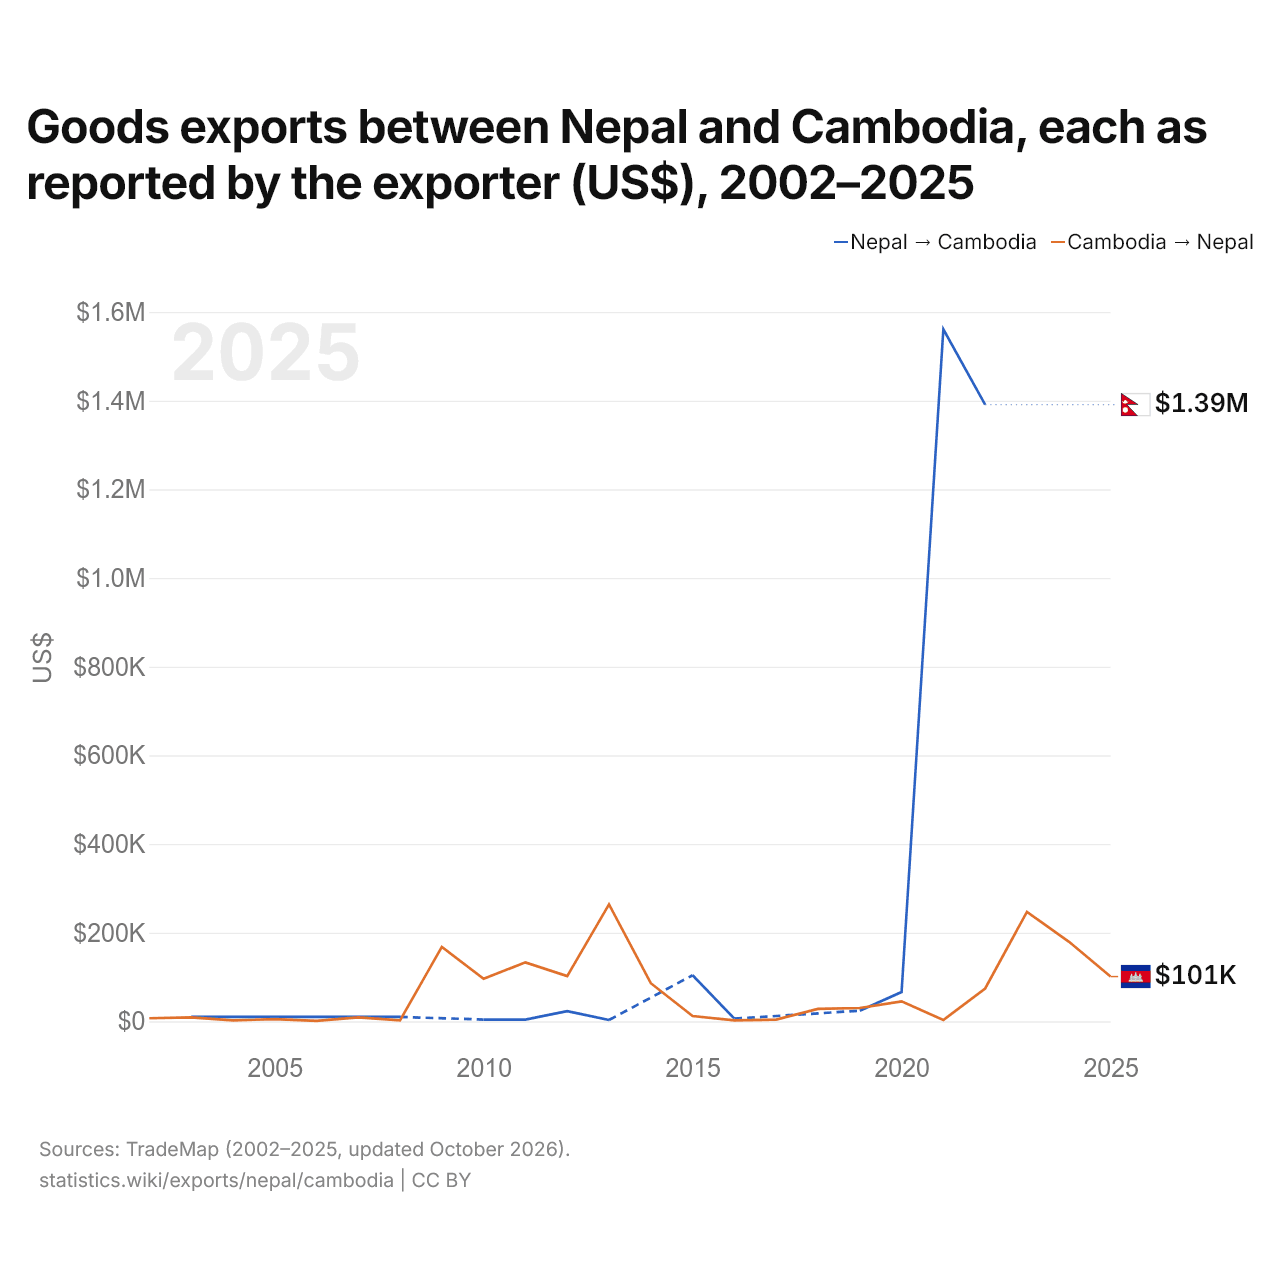
Exportaciones de bienes entre Nepal y Camboya, según declara el exportador (US$), 2002–2025
| Año | US$ | |
|---|---|---|
| Nepal → Camboya | Camboya → Nepal | |
| 2025 | - | 101.000 US$ |
| 2024 | - | 180.000 US$ |
| 2023 | - | 247.000 US$ |
| 2022 | 1.391.000 US$ | 74.000 US$ |
| 2021 | 1.561.000 US$ | 3.000 US$ |
| 2020 | 66.000 US$ | 45.000 US$ |
| 2019 | 24.000 US$ | 30.000 US$ |
| 2018 | - | 28.000 US$ |
| 2017 | - | 4.000 US$ |
| 2016 | 6.000 US$ | 2.000 US$ |
| 2015 | 104.000 US$ | 12.000 US$ |
| 2014 | - | 86.000 US$ |
| 2013 | 3.000 US$ | 264.000 US$ |
| 2012 | 23.000 US$ | 102.000 US$ |
| 2011 | 4.000 US$ | 133.000 US$ |
| 2010 | 4.000 US$ | 96.000 US$ |
| 2009 | - | 168.000 US$ |
| 2008 | 10.000 US$ | 2.000 US$ |
| 2007 | 10.000 US$ | 9.000 US$ |
| 2006 | 10.000 US$ | 1.000 US$ |
| 2005 | 10.000 US$ | 5.000 US$ |
| 2004 | 10.000 US$ | 2.000 US$ |
| 2003 | 10.000 US$ | 9.000 US$ |
| 2002 | - | 7.000 US$ |
Las exportaciones de bienes de Nepal hacia Camboya, según Nepal, fueron de 1,39 millones de US$, y las de Camboya hacia Nepal, según Camboya, de 74.000 US$: 19 veces más desde Nepal. En 2003, fueron de 10.000 US$ desde Nepal y de 9000 US$ desde Camboya.
Nepal vs Camboya: cifras de exportaciones
|
Nepal
|
Camboya
|
|
|---|---|---|
| Exportaciones | 4020 M US$ (2025) | 35,2 mil M US$ (2025) |
| Puesto mundial | 137/176 | 75/176 |
| Porcentaje del mundo | 0,01 % | 0,1 % |
| % del PIB | 8,8 % | 68,6 % |
| Mayor categoría de bienes | Alimentos elaborados, aceites, piensos, bebidas y tabaco (39,9 %, 2022) | Textiles, ropa, calzado, muebles y juguetes (60,2 %, 2025) |
| Principal destino de bienes | India (71,9 %, 2022) | Estados Unidos (40,7 %, 2025) |
Comparar las exportaciones de 2 países cualesquiera
Fuentes:
- Banco Mundial | Economía y crecimiento (1965–2025, actualizado en octubre de 2026)
- TradeMap (2002–2025, actualizado en octubre de 2026)
Creative Commons Atribución (CC BY): puedes copiar, compartir, adaptar y reutilizar este contenido, también con fines comerciales, siempre que cites a statistics.wiki e indiques los cambios que hayas hecho. Las fuentes indicadas arriba pueden tener sus propias condiciones de licencia.