
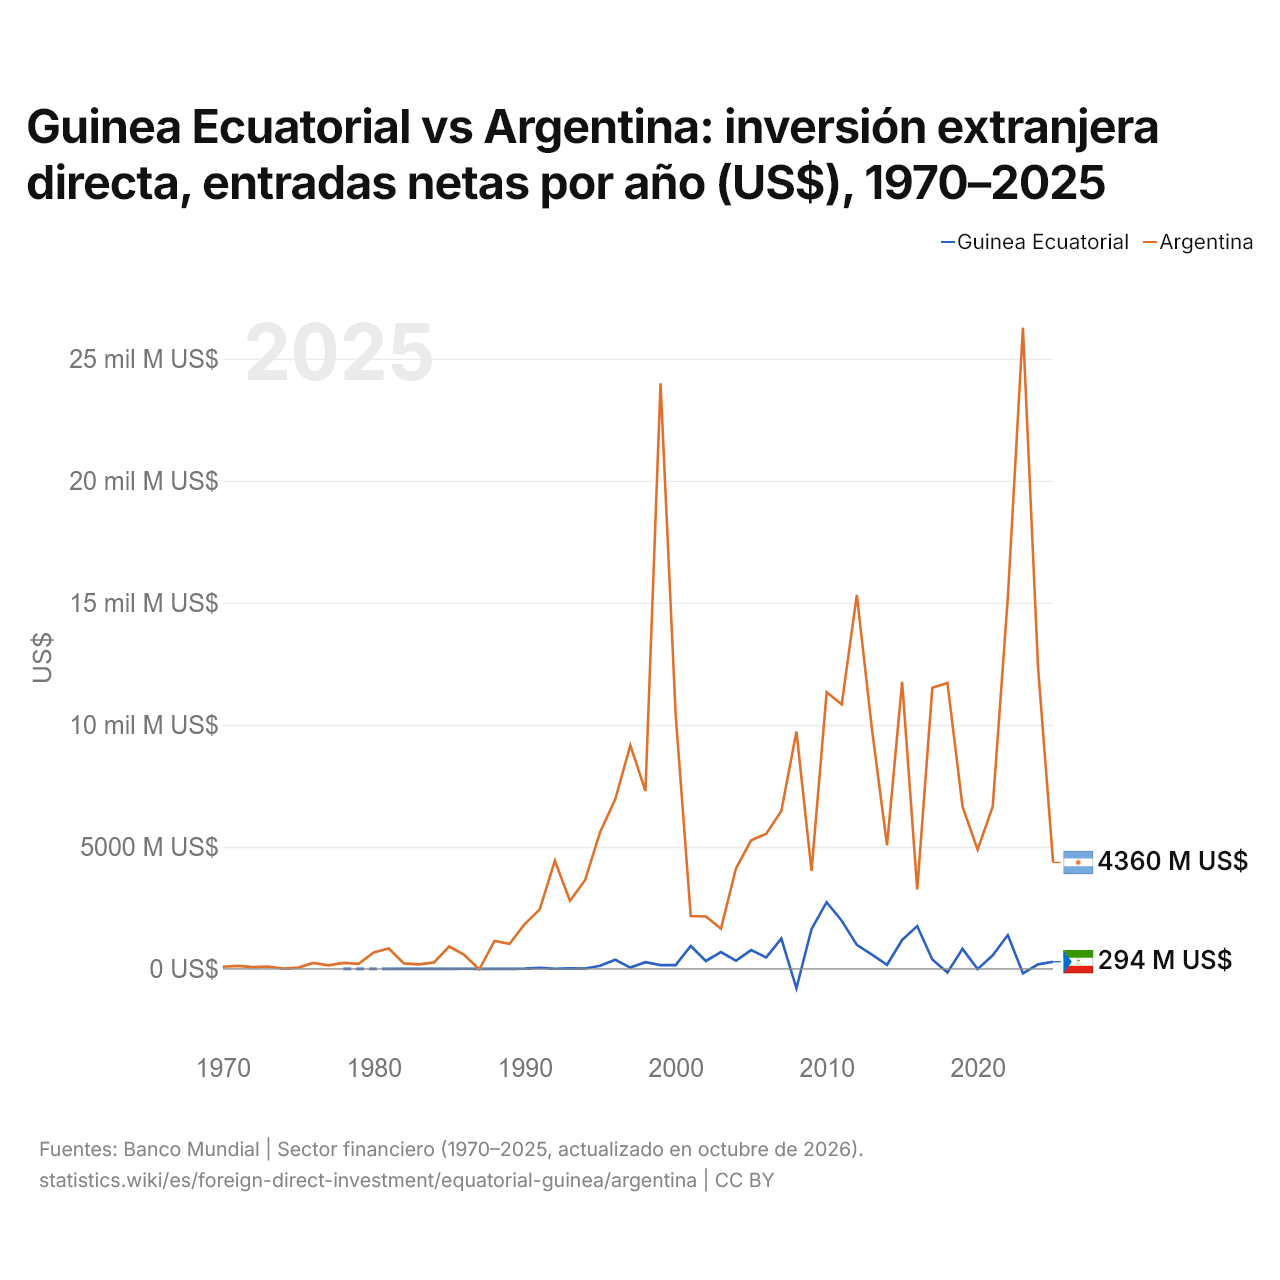
Guinea Ecuatorial vs Argentina: inversión extranjera directa, entradas netas por año (US$), 1970–2025
| Año | US$ | |
|---|---|---|
 Guinea Ecuatorial |
 Argentina |
|
| 2025 | 293.850.543 US$ | 4.361.728.627 US$ |
| 2024 | 188.011.683 US$ | 12.364.505.139 US$ |
| 2023 | −182.216.472 US$ | 26.267.380.170 US$ |
| 2022 | 1.388.191.636 US$ | 15.206.087.397 US$ |
| 2021 | 561.595.623 US$ | 6.658.049.679 US$ |
| 2020 | −9.072.493 US$ | 4.884.127.676 US$ |
| 2019 | 821.413.132 US$ | 6.649.187.838 US$ |
| 2018 | −144.465.770 US$ | 11.716.769.819 US$ |
| 2017 | 384.833.208 US$ | 11.516.861.462 US$ |
| 2016 | 1.755.302.287 US$ | 3.260.164.342 US$ |
| 2015 | 1.187.699.014 US$ | 11.758.994.011 US$ |
| 2014 | 167.875.183 US$ | 5.065.335.542 US$ |
| 2013 | 582.948.702 US$ | 9.821.661.858 US$ |
| 2012 | 985.256.412 US$ | 15.323.933.917 US$ |
| 2011 | 1.975.000.000 US$ | 10.839.930.945 US$ |
| 2010 | 2.734.000.000 US$ | 11.332.718.626 US$ |
| 2009 | 1.636.219.625 US$ | 4.017.158.925 US$ |
| 2008 | −793.872.333 US$ | 9.725.553.130 US$ |
| 2007 | 1.242.731.087 US$ | 6.473.157.762 US$ |
| 2006 | 469.506.015 US$ | 5.537.347.786 US$ |
| 2005 | 769.146.185 US$ | 5.265.250.000 US$ |
| 2004 | 340.914.469 US$ | 4.124.710.000 US$ |
| 2003 | 689.779.766 US$ | 1.652.010.000 US$ |
| 2002 | 323.391.507 US$ | 2.148.910.000 US$ |
| 2001 | 940.741.216 US$ | 2.166.136.830 US$ |
| 2000 | 154.499.590 US$ | 10.418.314.339 US$ |
| 1999 | 154.296.174 US$ | 23.987.696.390 US$ |
| 1998 | 274.768.117 US$ | 7.290.657.132 US$ |
| 1997 | 53.451.528 US$ | 9.160.272.052 US$ |
| 1996 | 376.180.404 US$ | 6.948.536.687 US$ |
| 1995 | 126.924.171 US$ | 5.609.423.404 US$ |
| 1994 | 16.995.533 US$ | 3.634.931.878 US$ |
| 1993 | 22.301.676 US$ | 2.793.085.410 US$ |
| 1992 | 6.018.320 US$ | 4.430.977.523 US$ |
| 1991 | 41.324.759 US$ | 2.439.000.000 US$ |
| 1990 | 11.073.779 US$ | 1.836.000.000 US$ |
| 1989 | 890.259 US$ | 1.028.000.000 US$ |
| 1988 | 500.000 US$ | 1.147.000.000 US$ |
| 1987 | 1.680.000 US$ | −19.000.000 US$ |
| 1986 | 5.630.000 US$ | 574.000.000 US$ |
| 1985 | 2.440.000 US$ | 919.000.000 US$ |
| 1984 | 2.170.000 US$ | 268.000.000 US$ |
| 1983 | 520.000 US$ | 185.000.000 US$ |
| 1982 | 450.000 US$ | 227.000.000 US$ |
| 1981 | −180.000 US$ | 837.000.000 US$ |
| 1980 | - | 678.000.000 US$ |
| 1979 | - | 206.000.000 US$ |
| 1978 | −20.000 US$ | 250.000.000 US$ |
| 1977 | - | 144.000.000 US$ |
| 1976 | - | 244.680.000 US$ |
| 1975 | - | 55.590.000 US$ |
| 1974 | - | 17.920.000 US$ |
| 1973 | - | 100.250.000 US$ |
| 1972 | - | 71.720.000 US$ |
| 1971 | - | 125.670.000 US$ |
| 1970 | - | 89.770.000 US$ |
En 2025, las entradas netas de inversión extranjera directa fueron de 294 millones de US$ en Guinea Ecuatorial y de 4,36 mil millones de US$ en Argentina: 15 veces más en Argentina. En 1978, fueron negativas en Guinea Ecuatorial, de 20.000 US$ y de 250 millones de US$ en Argentina.
Las entradas netas de inversión extranjera directa en Guinea Ecuatorial fueron mayores que en Argentina en uno de los 46 años de 1978 a 2025 que ambos países comunicaron, y menores en 45.
Guinea Ecuatorial vs Argentina: últimas entradas y salidas de inversión extranjera
|
Guinea Ecuatorial
|
Argentina
|
|
|---|---|---|
| Entradas netas | +294 M US$ | +4360 M US$ |
| Entradas netas, % del PIB | +2,3 % | +0,6 % |
| Salidas netas | +22,2 M US$ | +2740 M US$ |
| Entradas netas, total 2016–2025 | +5060 M US$ | +103 mil M US$ |
| Puesto mundial | 126/192 | 49/192 |
Comparar la inversión extranjera directa de 2 países cualesquiera
Fuentes:
- Banco Mundial | Sector financiero (1970–2025, actualizado en octubre de 2026)
Creative Commons Atribución (CC BY): puedes copiar, compartir, adaptar y reutilizar este contenido, también con fines comerciales, siempre que cites a statistics.wiki e indiques los cambios que hayas hecho. Las fuentes indicadas arriba pueden tener sus propias condiciones de licencia.