
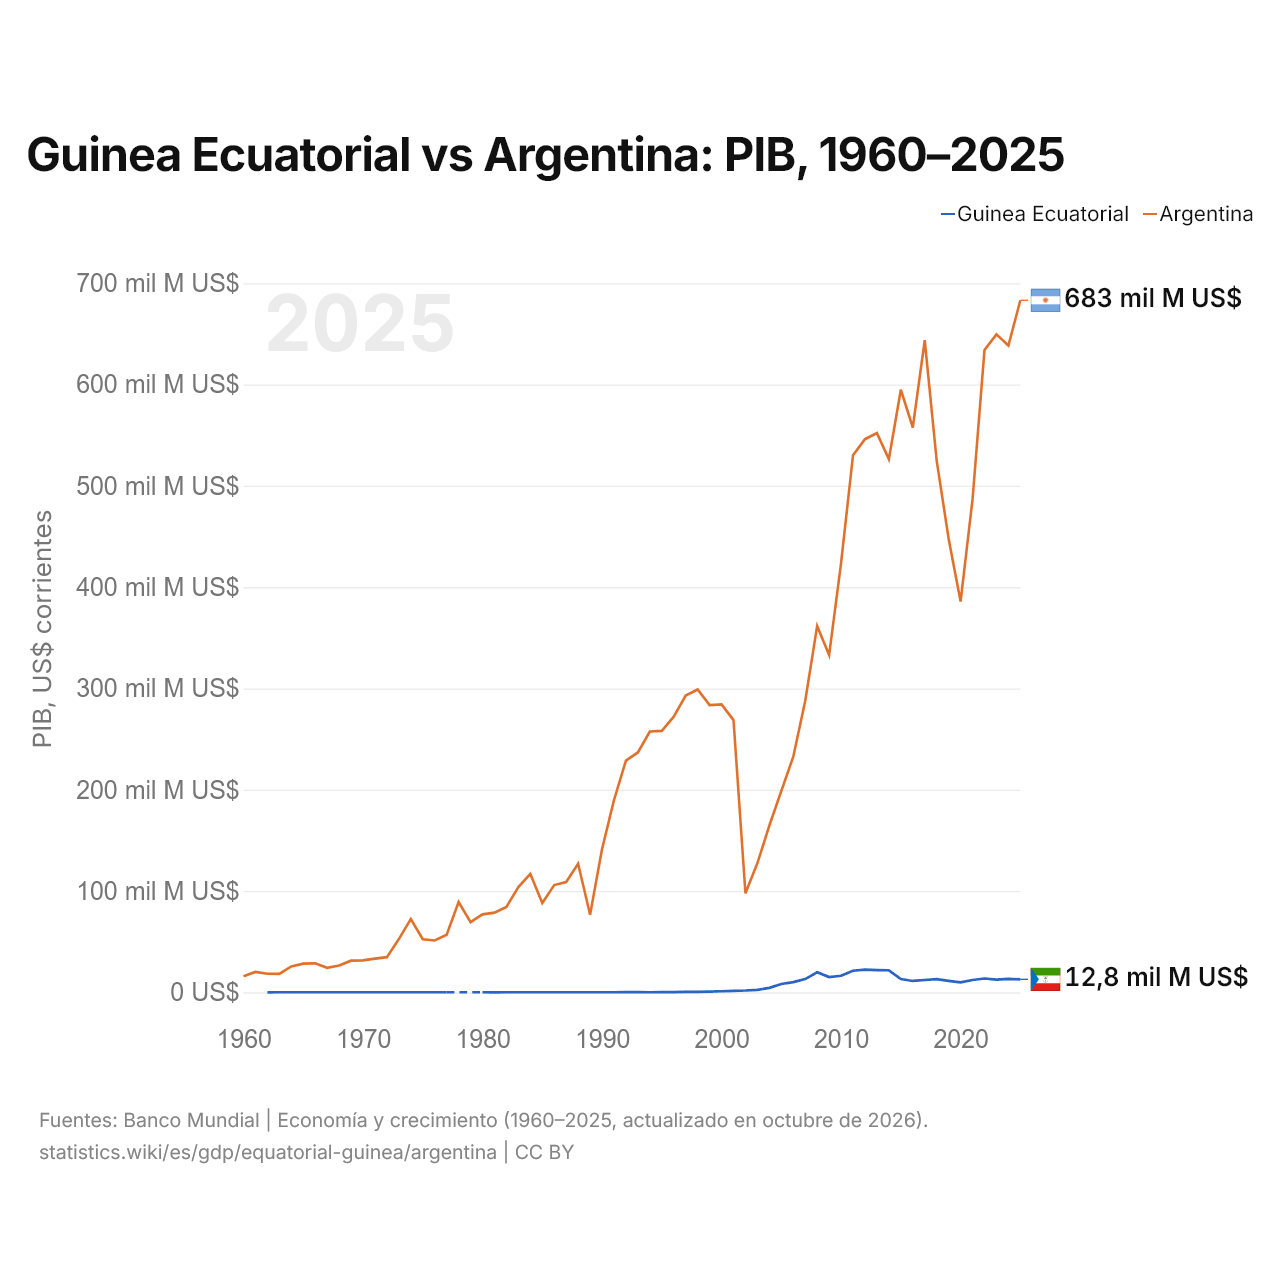
Guinea Ecuatorial vs Argentina: PIB, 1960–2025
| Año | PIB, US$ corrientes | |
|---|---|---|
 Guinea Ecuatorial |
 Argentina |
|
| 2025 | 12.823.210.426 US$ | 683.097.891.619 US$ |
| 2024 | 13.254.388.261 US$ | 638.365.455.340 US$ |
| 2023 | 12.541.814.273 US$ | 649.461.687.959 US$ |
| 2022 | 13.687.643.436 US$ | 633.993.756.301 US$ |
| 2021 | 12.215.878.033 US$ | 486.564.085.480 US$ |
| 2020 | 9.893.816.008 US$ | 385.740.508.437 US$ |
| 2019 | 11.364.133.550 US$ | 447.754.683.615 US$ |
| 2018 | 13.097.012.134 US$ | 524.819.892.360 US$ |
| 2017 | 12.200.913.879 US$ | 643.628.393.281 US$ |
| 2016 | 11.240.808.848 US$ | 557.532.320.663 US$ |
| 2015 | 13.185.496.881 US$ | 594.749.285.413 US$ |
| 2014 | 21.765.453.082 US$ | 526.319.673.732 US$ |
| 2013 | 21.948.834.284 US$ | 552.025.140.252 US$ |
| 2012 | 22.388.344.144 US$ | 545.982.375.701 US$ |
| 2011 | 21.357.343.669 US$ | 530.158.122.010 US$ |
| 2010 | 16.314.443.436 US$ | 423.627.422.092 US$ |
| 2009 | 15.027.795.173 US$ | 332.976.484.578 US$ |
| 2008 | 19.749.893.536 US$ | 361.558.037.110 US$ |
| 2007 | 13.071.718.759 US$ | 287.530.508.431 US$ |
| 2006 | 10.086.528.699 US$ | 232.557.260.817 US$ |
| 2005 | 8.217.369.093 US$ | 198.737.095.012 US$ |
| 2004 | 4.410.764.339 US$ | 164.657.930.453 US$ |
| 2003 | 2.484.745.935 US$ | 127.586.973.492 US$ |
| 2002 | 1.806.742.742 US$ | 97.724.004.252 US$ |
| 2001 | 1.461.139.022 US$ | 268.696.750.000 US$ |
| 2000 | 1.045.998.496 US$ | 284.203.750.000 US$ |
| 1999 | 621.117.886 US$ | 283.523.000.000 US$ |
| 1998 | 370.687.634 US$ | 298.948.250.000 US$ |
| 1997 | 442.337.871 US$ | 292.859.000.000 US$ |
| 1996 | 232.463.023 US$ | 272.149.750.000 US$ |
| 1995 | 141.853.361 US$ | 258.031.750.000 US$ |
| 1994 | 100.807.003 US$ | 257.440.000.000 US$ |
| 1993 | 136.047.906 US$ | 236.741.715.015 US$ |
| 1992 | 134.707.184 US$ | 228.778.917.308 US$ |
| 1991 | 110.906.029 US$ | 189.719.984.268 US$ |
| 1990 | 112.119.411 US$ | 141.352.654.305 US$ |
| 1989 | 88.265.975 US$ | 76.629.728.760 US$ |
| 1988 | 100.534.657 US$ | 126.890.235.049 US$ |
| 1987 | 93.345.860 US$ | 108.810.885.301 US$ |
| 1986 | 76.407.396 US$ | 105.872.372.614 US$ |
| 1985 | 62.118.570 US$ | 88.150.891.728 US$ |
| 1984 | 50.320.914 US$ | 116.915.052.107 US$ |
| 1983 | 44.442.457 US$ | 103.979.106.778 US$ |
| 1982 | 44.294.648 US$ | 84.307.486.837 US$ |
| 1981 | 36.731.423 US$ | 78.676.842.367 US$ |
| 1980 | 50.642.881 US$ | 76.961.923.741 US$ |
| 1979 | - | 69.252.328.952 US$ |
| 1978 | - | 89.049.453.088 US$ |
| 1977 | 103.987.520 US$ | 56.781.000.101 US$ |
| 1976 | 103.653.050 US$ | 51.169.499.892 US$ |
| 1975 | 104.295.643 US$ | 52.438.647.922 US$ |
| 1974 | 94.159.863 US$ | 72.436.777.342 US$ |
| 1973 | 81.203.227 US$ | 52.544.000.117 US$ |
| 1972 | 65.429.198 US$ | 34.733.000.536 US$ |
| 1971 | 64.946.955 US$ | 33.293.199.095 US$ |
| 1970 | 66.331.429 US$ | 31.584.210.366 US$ |
| 1969 | 67.225.714 US$ | 31.256.284.544 US$ |
| 1968 | 67.514.286 US$ | 26.436.857.247 US$ |
| 1967 | 72.317.447 US$ | 24.256.667.553 US$ |
| 1966 | 69.110.000 US$ | 28.630.474.728 US$ |
| 1965 | 64.748.333 US$ | 28.344.705.967 US$ |
| 1964 | 51.915.000 US$ | 25.605.249.382 US$ |
| 1963 | 44.266.667 US$ | 18.272.123.664 US$ |
| 1962 | 37.253.333 US$ | 18.337.691.145 US$ |
| 1961 | - | 20.132.220.375 US$ |
| 1960 | - | 15.865.474.315 US$ |
En 2025, el PIB de Argentina (683 mil millones de US$) fue 53 veces el de Guinea Ecuatorial (12,8 mil millones de US$). En 2015 era 45 veces. De 2015 a 2025, a precios constantes de 2015, el PIB de Argentina creció un 2,4 %, mientras que el de Guinea Ecuatorial cayó un 33,9 %.
Desde 1962, el PIB de Argentina ha sido cada año el mayor de los dos; en 1962, era 490 veces el de Guinea Ecuatorial. En 2025, el PIB per cápita fue de 6615 US$ en Guinea Ecuatorial y de 14.898 US$ en Argentina: 2,3 veces más alto en Argentina.
Guinea Ecuatorial vs Argentina: últimos datos del PIB
|
Guinea Ecuatorial
|
Argentina
|
|
|---|---|---|
| PIB, US$ corrientes | 12,8 mil M US$ | 683 mil M US$ |
| Puesto mundial | 150/197 | 25/197 |
| Porcentaje del mundo | 0,01 % | 0,58 % |
| PIB, US$ constantes de 2015 | 8720 M US$ | 609 mil M US$ |
| Diferencia de PIB | 0,019× | 53× |
Comparar el PIB de 2 países cualesquiera
Fuentes:
- Banco Mundial | Economía y crecimiento (1960–2025, actualizado en octubre de 2026)
Creative Commons Atribución (CC BY): puedes copiar, compartir, adaptar y reutilizar este contenido, también con fines comerciales, siempre que cites a statistics.wiki e indiques los cambios que hayas hecho. Las fuentes indicadas arriba pueden tener sus propias condiciones de licencia.