
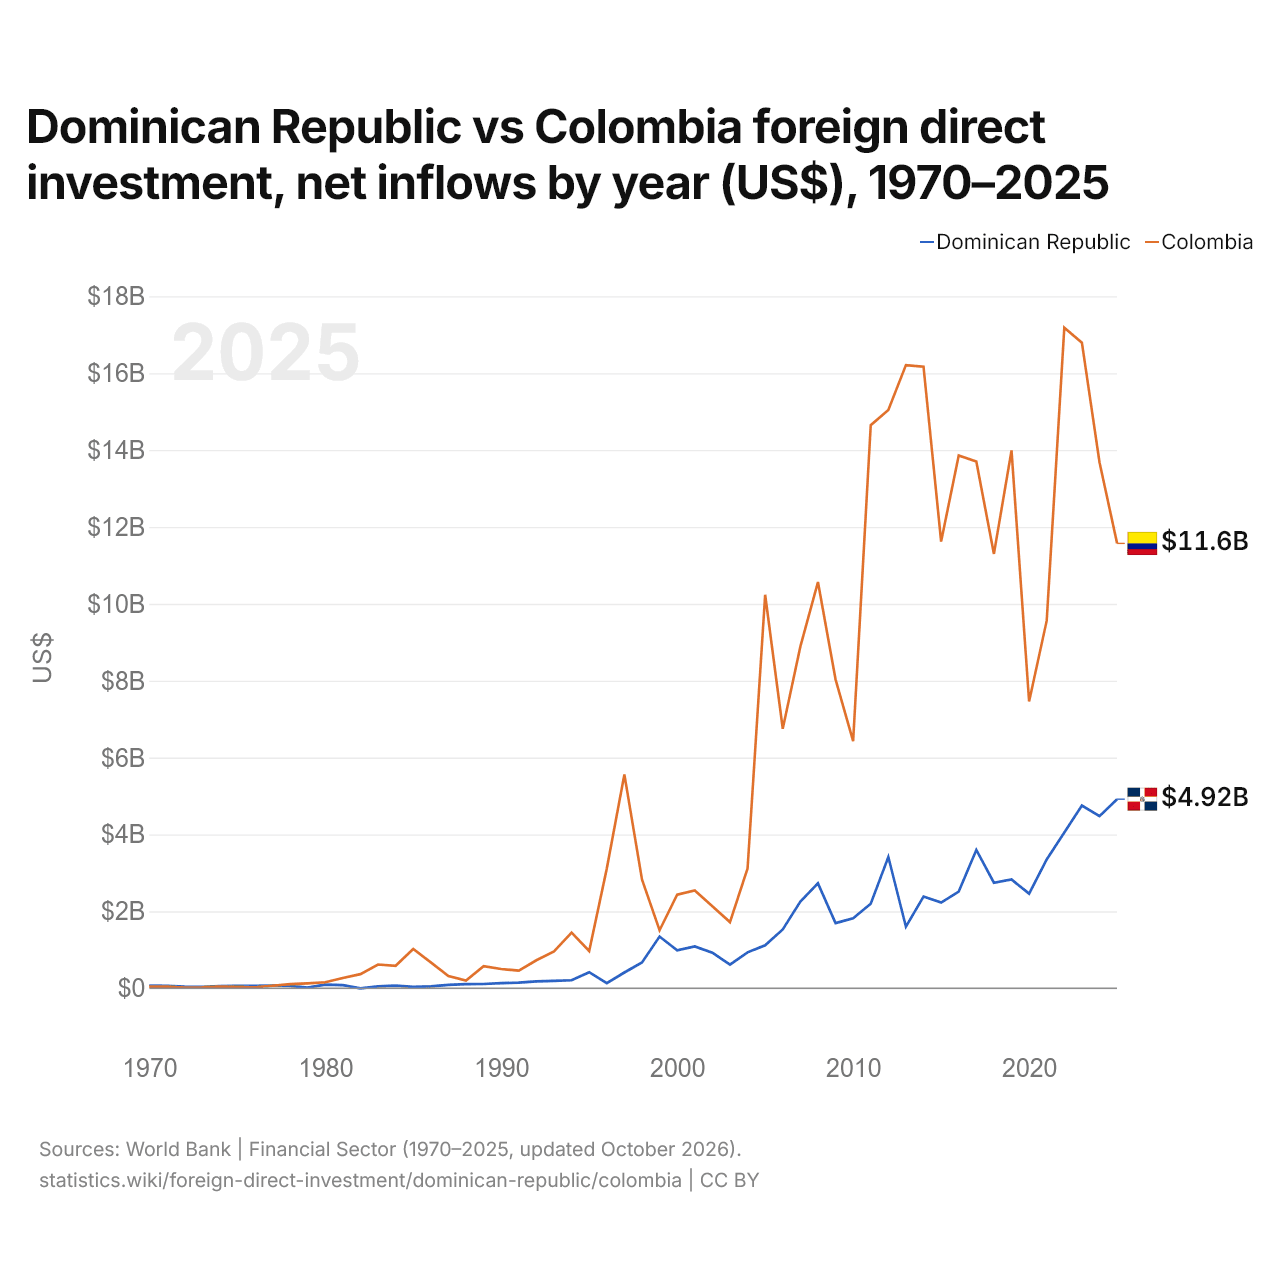
República Dominicana vs Colombia: inversión extranjera directa, entradas netas por año (US$), 1970–2025
| Año | US$ | |
|---|---|---|
 República [...] |
 Colombia |
|
| 2025 | 4.918.800.000 US$ | 11.571.143.771 US$ |
| 2024 | 4.475.900.000 US$ | 13.683.876.155 US$ |
| 2023 | 4.750.500.000 US$ | 16.793.702.729 US$ |
| 2022 | 4.050.000.000 US$ | 17.182.225.498 US$ |
| 2021 | 3.349.700.000 US$ | 9.561.335.277 US$ |
| 2020 | 2.460.600.000 US$ | 7.458.624.984 US$ |
| 2019 | 2.829.200.000 US$ | 13.989.154.028 US$ |
| 2018 | 2.744.500.000 US$ | 11.298.692.774 US$ |
| 2017 | 3.597.900.000 US$ | 13.700.880.445 US$ |
| 2016 | 2.516.100.000 US$ | 13.857.937.721 US$ |
| 2015 | 2.227.300.000 US$ | 11.620.532.646 US$ |
| 2014 | 2.385.300.000 US$ | 16.168.701.715 US$ |
| 2013 | 1.599.900.000 US$ | 16.210.419.016 US$ |
| 2012 | 3.415.900.000 US$ | 15.039.979.139 US$ |
| 2011 | 2.197.500.000 US$ | 14.647.048.638 US$ |
| 2010 | 1.820.200.000 US$ | 6.429.989.613 US$ |
| 2009 | 1.695.300.000 US$ | 8.034.746.177 US$ |
| 2008 | 2.728.400.000 US$ | 10.564.155.796 US$ |
| 2007 | 2.252.900.000 US$ | 8.885.764.398 US$ |
| 2006 | 1.528.700.000 US$ | 6.750.625.311 US$ |
| 2005 | 1.118.400.000 US$ | 10.235.417.315 US$ |
| 2004 | 934.480.000 US$ | 3.115.635.874 US$ |
| 2003 | 616.530.000 US$ | 1.720.493.455 US$ |
| 2002 | 926.000.000 US$ | 2.133.698.124 US$ |
| 2001 | 1.087.900.000 US$ | 2.541.942.612 US$ |
| 2000 | 989.000.000 US$ | 2.436.459.923 US$ |
| 1999 | 1.344.900.000 US$ | 1.507.907.130 US$ |
| 1998 | 668.900.000 US$ | 2.828.826.262 US$ |
| 1997 | 408.700.000 US$ | 5.562.216.362 US$ |
| 1996 | 134.200.000 US$ | 3.111.676.590 US$ |
| 1995 | 417.400.000 US$ | 968.368.274 US$ |
| 1994 | 208.100.000 US$ | 1.446.497.261 US$ |
| 1993 | 190.700.000 US$ | 959.100.000 US$ |
| 1992 | 179.700.000 US$ | 728.700.000 US$ |
| 1991 | 145.000.000 US$ | 456.900.000 US$ |
| 1990 | 132.800.000 US$ | 500.000.000 US$ |
| 1989 | 110.000.000 US$ | 576.000.000 US$ |
| 1988 | 106.100.000 US$ | 203.000.000 US$ |
| 1987 | 89.000.000 US$ | 319.000.000 US$ |
| 1986 | 50.000.000 US$ | 674.000.000 US$ |
| 1985 | 36.200.000 US$ | 1.023.000.000 US$ |
| 1984 | 68.500.000 US$ | 584.000.000 US$ |
| 1983 | 48.200.000 US$ | 618.000.000 US$ |
| 1982 | −1.400.000 US$ | 366.000.000 US$ |
| 1981 | 79.700.000 US$ | 265.000.000 US$ |
| 1980 | 92.700.000 US$ | 157.137.700 US$ |
| 1979 | 17.100.000 US$ | 127.000.000 US$ |
| 1978 | 63.600.000 US$ | 107.000.000 US$ |
| 1977 | 71.500.000 US$ | 65.000.000 US$ |
| 1976 | 60.000.000 US$ | 25.000.000 US$ |
| 1975 | 63.900.000 US$ | 37.068.850 US$ |
| 1974 | 53.600.000 US$ | 40.889.760 US$ |
| 1973 | 34.500.000 US$ | 23.842.600 US$ |
| 1972 | 43.500.000 US$ | 18.457.070 US$ |
| 1971 | 65.000.000 US$ | 43.128.140 US$ |
| 1970 | 71.600.000 US$ | 43.000.000 US$ |
En 2025, las entradas netas de inversión extranjera directa fueron de 4,92 mil millones de US$ en la República Dominicana y de 11,6 mil millones de US$ en Colombia: 2,4 veces más en Colombia. En 1970, fueron de 71,6 millones de US$ en la República Dominicana y de 43 millones de US$ en Colombia.
Las entradas netas de inversión extranjera directa en la República Dominicana fueron mayores que en Colombia en 8 de los 56 años de 1970 a 2025, y menores en 48.
República Dominicana vs Colombia: últimas entradas y salidas de inversión extranjera
|
República [...]
|
Colombia
|
|
|---|---|---|
| Entradas netas | +4920 M US$ | +11,6 mil M US$ |
| Entradas netas, % del PIB | +3,9 % | +2,5 % |
| Salidas netas | −114 M US$ | +4820 M US$ |
| Entradas netas, total 2016–2025 | +35,7 mil M US$ | +129 mil M US$ |
| Puesto mundial | 46/192 | 33/192 |
Comparar la inversión extranjera directa de 2 países cualesquiera
Fuentes:
- Banco Mundial | Sector financiero (1970–2025, actualizado en octubre de 2026)
Creative Commons Atribución (CC BY): puedes copiar, compartir, adaptar y reutilizar este contenido, también con fines comerciales, siempre que cites a statistics.wiki e indiques los cambios que hayas hecho. Las fuentes indicadas arriba pueden tener sus propias condiciones de licencia.