
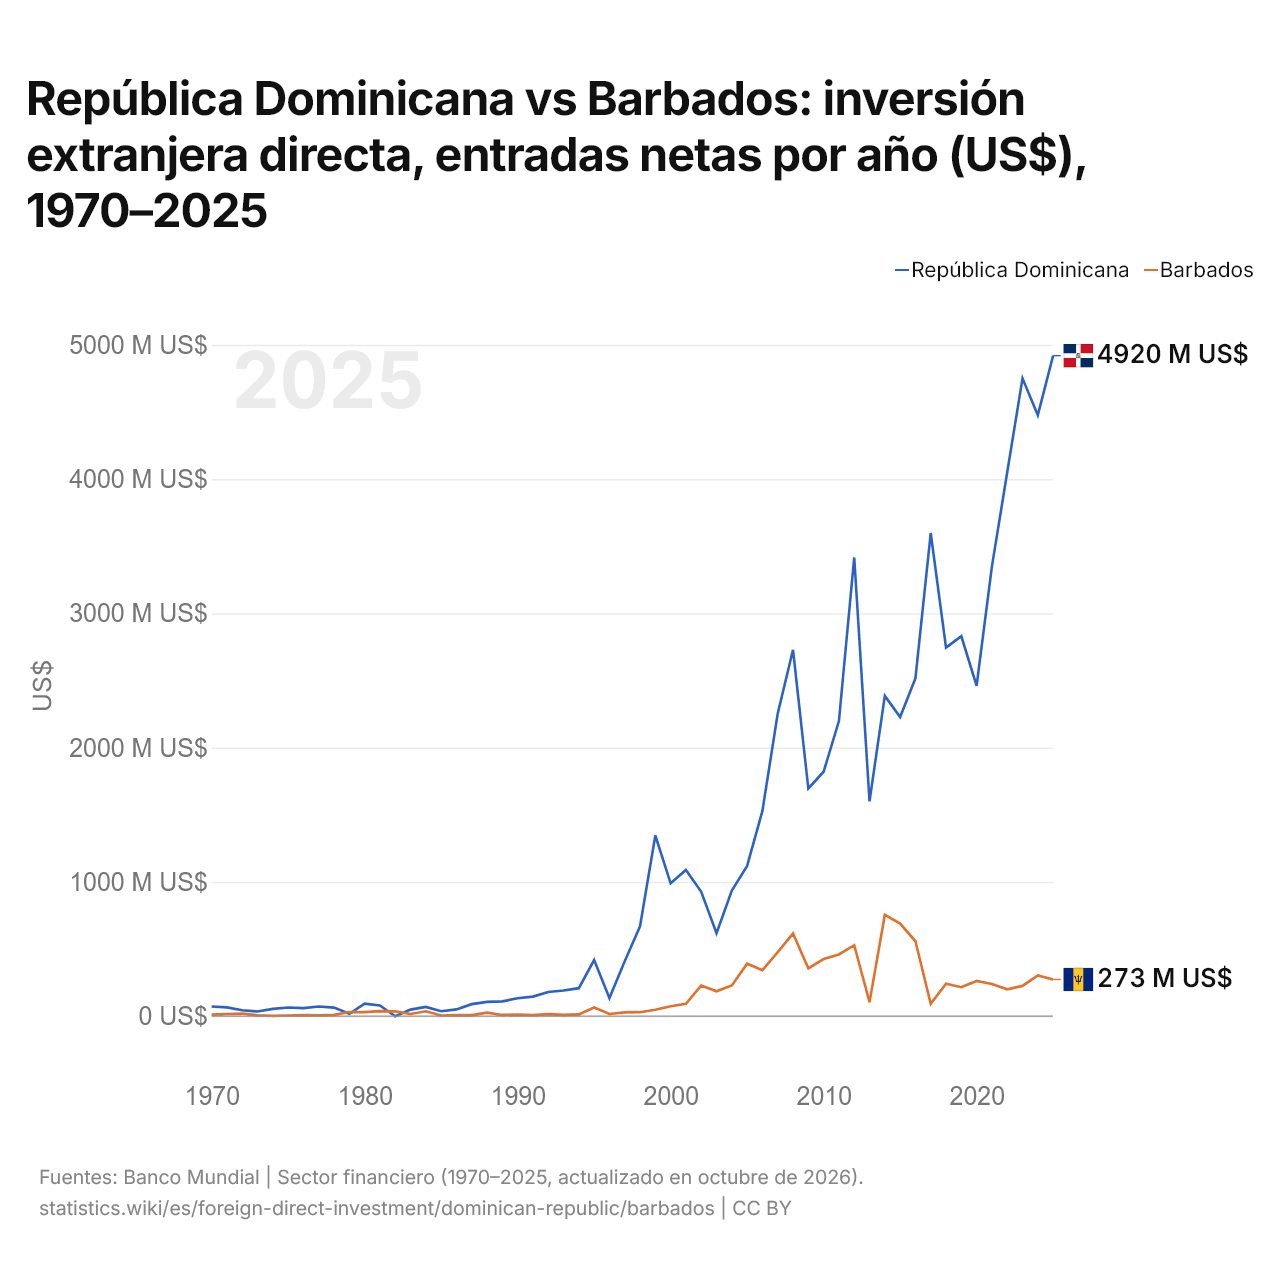
República Dominicana vs Barbados: inversión extranjera directa, entradas netas por año (US$), 1970–2025
| Año | US$ | |
|---|---|---|
 República [...] |
 Barbados |
|
| 2025 | 4.918.800.000 US$ | 273.091.359 US$ |
| 2024 | 4.475.900.000 US$ | 303.060.013 US$ |
| 2023 | 4.750.500.000 US$ | 224.900.000 US$ |
| 2022 | 4.050.000.000 US$ | 200.000.000 US$ |
| 2021 | 3.349.700.000 US$ | 238.735.064 US$ |
| 2020 | 2.460.600.000 US$ | 262.100.000 US$ |
| 2019 | 2.829.200.000 US$ | 215.370.129 US$ |
| 2018 | 2.744.500.000 US$ | 241.596.500 US$ |
| 2017 | 3.597.900.000 US$ | 91.481.933 US$ |
| 2016 | 2.516.100.000 US$ | 557.500.316 US$ |
| 2015 | 2.227.300.000 US$ | 688.525.943 US$ |
| 2014 | 2.385.300.000 US$ | 753.687.476 US$ |
| 2013 | 1.599.900.000 US$ | 104.089.451 US$ |
| 2012 | 3.415.900.000 US$ | 528.045.665 US$ |
| 2011 | 2.197.500.000 US$ | 459.552.936 US$ |
| 2010 | 1.820.200.000 US$ | 425.337.313 US$ |
| 2009 | 1.695.300.000 US$ | 356.008.255 US$ |
| 2008 | 2.728.400.000 US$ | 615.122.885 US$ |
| 2007 | 2.252.900.000 US$ | 476.404.577 US$ |
| 2006 | 1.528.700.000 US$ | 342.267.498 US$ |
| 2005 | 1.118.400.000 US$ | 390.061.396 US$ |
| 2004 | 934.480.000 US$ | 228.334.500 US$ |
| 2003 | 616.530.000 US$ | 184.701.289 US$ |
| 2002 | 926.000.000 US$ | 228.343.254 US$ |
| 2001 | 1.087.900.000 US$ | 91.504.911 US$ |
| 2000 | 989.000.000 US$ | 73.696.944 US$ |
| 1999 | 1.344.900.000 US$ | 47.539.505 US$ |
| 1998 | 668.900.000 US$ | 29.160.482 US$ |
| 1997 | 408.700.000 US$ | 28.203.499 US$ |
| 1996 | 134.200.000 US$ | 15.836.484 US$ |
| 1995 | 417.400.000 US$ | 63.803.750 US$ |
| 1994 | 208.100.000 US$ | 12.950.000 US$ |
| 1993 | 190.700.000 US$ | 9.402.114 US$ |
| 1992 | 179.700.000 US$ | 14.450.000 US$ |
| 1991 | 145.000.000 US$ | 7.424.921 US$ |
| 1990 | 132.800.000 US$ | 11.213.283 US$ |
| 1989 | 110.000.000 US$ | 8.682.964 US$ |
| 1988 | 106.100.000 US$ | 25.979.409 US$ |
| 1987 | 89.000.000 US$ | 7.100.000 US$ |
| 1986 | 50.000.000 US$ | 7.750.000 US$ |
| 1985 | 36.200.000 US$ | 4.850.000 US$ |
| 1984 | 68.500.000 US$ | 36.000.000 US$ |
| 1983 | 48.200.000 US$ | 16.150.000 US$ |
| 1982 | −1.400.000 US$ | 35.150.000 US$ |
| 1981 | 79.700.000 US$ | 37.300.000 US$ |
| 1980 | 92.700.000 US$ | 29.300.000 US$ |
| 1979 | 17.100.000 US$ | 30.305.500 US$ |
| 1978 | 63.600.000 US$ | 8.987.000 US$ |
| 1977 | 71.500.000 US$ | 4.914.000 US$ |
| 1976 | 60.000.000 US$ | 6.897.500 US$ |
| 1975 | 63.900.000 US$ | 4.489.152 US$ |
| 1974 | 53.600.000 US$ | 2.397.685 US$ |
| 1973 | 34.500.000 US$ | 5.630.300 US$ |
| 1972 | 43.500.000 US$ | 19.139.837 US$ |
| 1971 | 65.000.000 US$ | 15.656.172 US$ |
| 1970 | 71.600.000 US$ | 10.868.500 US$ |
En 2025, las entradas netas de inversión extranjera directa fueron de 4,92 mil millones de US$ en la República Dominicana y de 273 millones de US$ en Barbados: 18 veces más en la República Dominicana. En 1970, fueron de 71,6 millones de US$ en la República Dominicana y de 10,9 millones de US$ en Barbados.
Las entradas netas de inversión extranjera directa en la República Dominicana fueron mayores que en Barbados en 54 de los 56 años de 1970 a 2025, y menores en 2.
República Dominicana vs Barbados: últimas entradas y salidas de inversión extranjera
|
República [...]
|
Barbados
|
|
|---|---|---|
| Entradas netas | +4920 M US$ | +273 M US$ |
| Entradas netas, % del PIB | +3,9 % | +3,4 % |
| Salidas netas | −114 M US$ | +16,7 M US$ |
| Entradas netas, total 2016–2025 | +35,7 mil M US$ | +2610 M US$ |
| Puesto mundial | 46/192 | 130/192 |
Comparar la inversión extranjera directa de 2 países cualesquiera
Fuentes:
- Banco Mundial | Sector financiero (1970–2025, actualizado en octubre de 2026)
Creative Commons Atribución (CC BY): puedes copiar, compartir, adaptar y reutilizar este contenido, también con fines comerciales, siempre que cites a statistics.wiki e indiques los cambios que hayas hecho. Las fuentes indicadas arriba pueden tener sus propias condiciones de licencia.