
Nepal vs Camboya: exportaciones de alimentos y productos agrícolas, 2001–2025 (incluye cueros y pieles)
| Año | Exportaciones | |
|---|---|---|
 Nepal |
 Camboya |
|
| 2025 | - | 4.117.029.000 US$ |
| 2024 | - | 4.154.624.000 US$ |
| 2023 | - | 3.945.103.000 US$ |
| 2022 | 662.290.000 US$ | 1.038.978.000 US$ |
| 2021 | 1.131.825.000 US$ | 947.230.000 US$ |
| 2020 | 457.567.000 US$ | 832.187.000 US$ |
| 2019 | 453.496.000 US$ | 731.148.000 US$ |
| 2018 | 244.213.000 US$ | 711.171.000 US$ |
| 2017 | 218.410.000 US$ | 580.559.000 US$ |
| 2016 | 198.262.000 US$ | 470.318.000 US$ |
| 2015 | 199.804.000 US$ | 433.518.000 US$ |
| 2014 | 262.964.000 US$ | 362.236.000 US$ |
| 2013 | 242.588.000 US$ | 405.905.000 US$ |
| 2012 | 247.102.000 US$ | 224.046.000 US$ |
| 2011 | 206.917.000 US$ | 180.634.000 US$ |
| 2010 | 216.916.000 US$ | 92.197.000 US$ |
| 2009 | 253.130.000 US$ | 58.586.000 US$ |
| 2008 | 146.203.000 US$ | 30.682.000 US$ |
| 2007 | 146.203.000 US$ | 30.486.000 US$ |
| 2006 | 146.203.000 US$ | 28.839.000 US$ |
| 2005 | 146.203.000 US$ | 29.535.000 US$ |
| 2004 | 146.203.000 US$ | 33.161.000 US$ |
| 2003 | 146.203.000 US$ | 11.821.000 US$ |
| 2002 | - | 15.617.000 US$ |
| 2001 | - | 18.828.000 US$ |
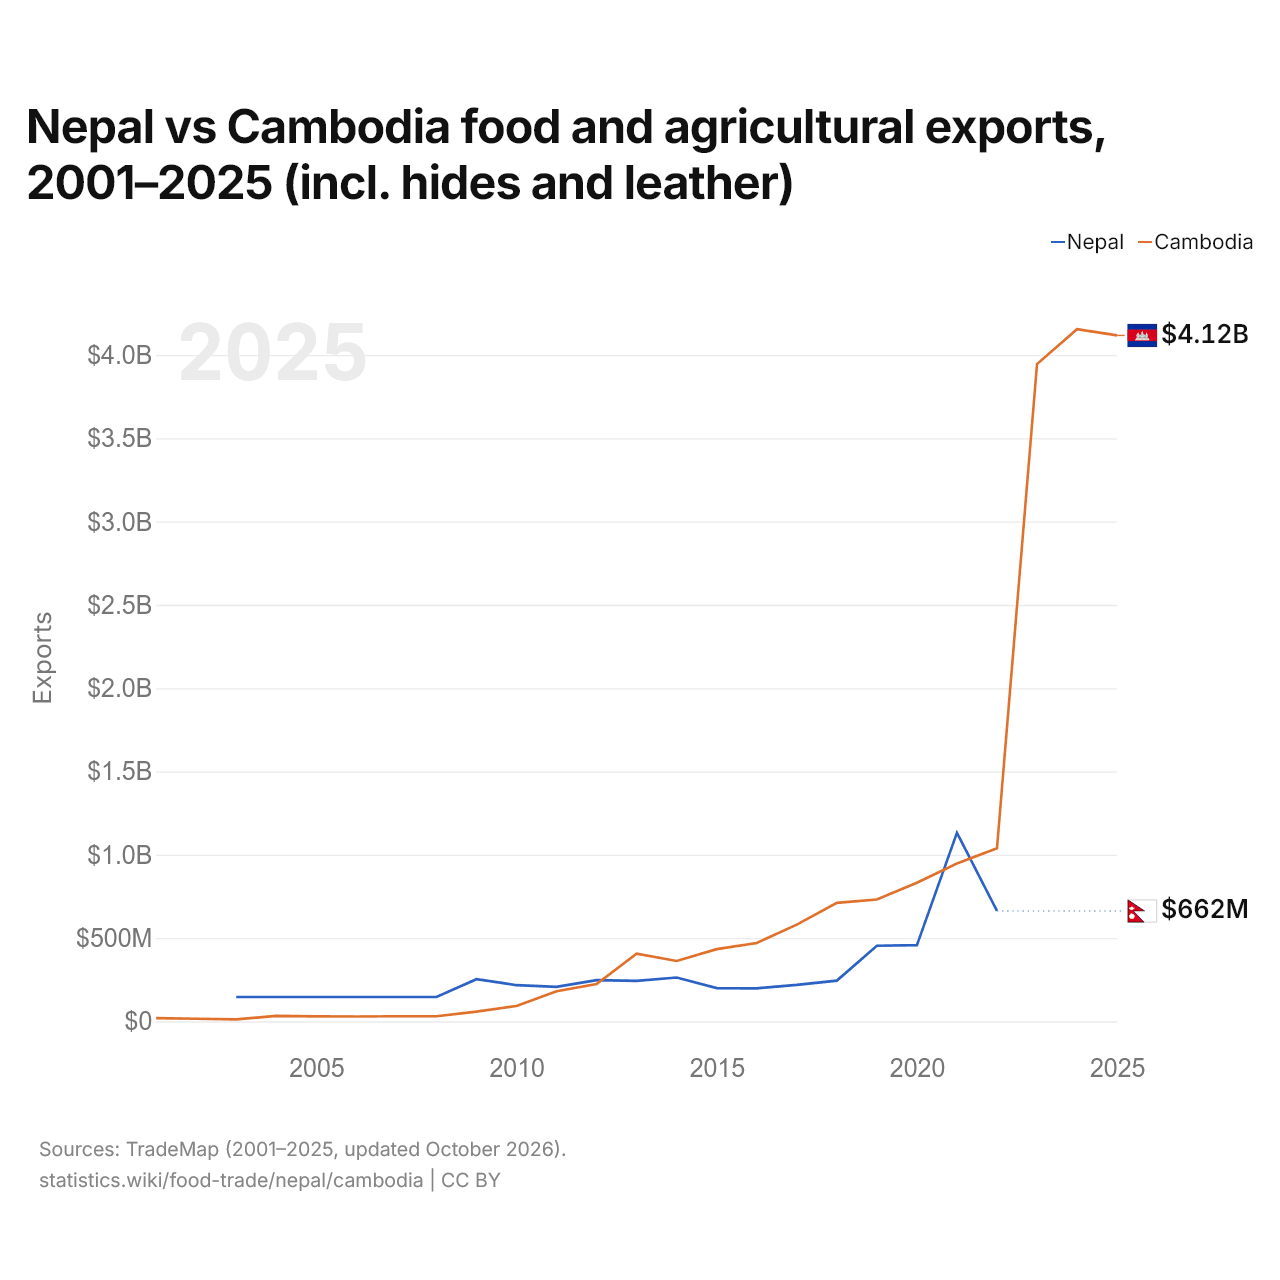
Las exportaciones de alimentos y productos agrícolas de Nepal fueron de 662 millones de US$ (2022) y las de Camboya, de 1,04 mil millones de US$ (2022): las de Camboya fueron 1,6 veces mayores. En 2003, las exportaciones de Nepal fueron 12 veces mayores: 146 millones de US$ de Nepal y 11,8 millones de US$ de Camboya.
Nepal vs Camboya: importaciones de alimentos y productos agrícolas, 2001–2025
| Año | Importaciones | |
|---|---|---|
|
Nepal
|
Camboya
|
|
| 2025 | - | 2.838.178.000 US$ |
| 2024 | - | 2.574.173.000 US$ |
| 2023 | - | 2.430.358.000 US$ |
| 2022 | 2.486.959.000 US$ | 2.217.541.000 US$ |
| 2021 | 3.330.053.000 US$ | 1.964.609.000 US$ |
| 2020 | 2.234.223.000 US$ | 1.841.541.000 US$ |
| 2019 | 2.097.717.000 US$ | 1.741.854.000 US$ |
| 2018 | 1.965.585.000 US$ | 1.606.520.000 US$ |
| 2017 | 1.815.920.000 US$ | 1.260.858.000 US$ |
| 2016 | 1.629.895.000 US$ | 1.089.955.000 US$ |
| 2015 | 1.189.106.000 US$ | 985.284.000 US$ |
| 2014 | 1.364.997.000 US$ | 902.350.000 US$ |
| 2013 | 1.242.393.000 US$ | 646.628.000 US$ |
| 2012 | 1.007.986.000 US$ | 592.527.000 US$ |
| 2011 | 824.658.000 US$ | 457.612.000 US$ |
| 2010 | 686.870.000 US$ | 388.267.000 US$ |
| 2009 | 535.328.000 US$ | 347.152.000 US$ |
| 2008 | 305.145.000 US$ | 336.379.000 US$ |
| 2007 | 305.145.000 US$ | 249.498.000 US$ |
| 2006 | 305.145.000 US$ | 235.963.000 US$ |
| 2005 | 305.145.000 US$ | 206.357.000 US$ |
| 2004 | 305.145.000 US$ | 181.344.000 US$ |
| 2003 | 305.145.000 US$ | 150.272.000 US$ |
| 2002 | - | 162.043.000 US$ |
| 2001 | - | 159.776.000 US$ |
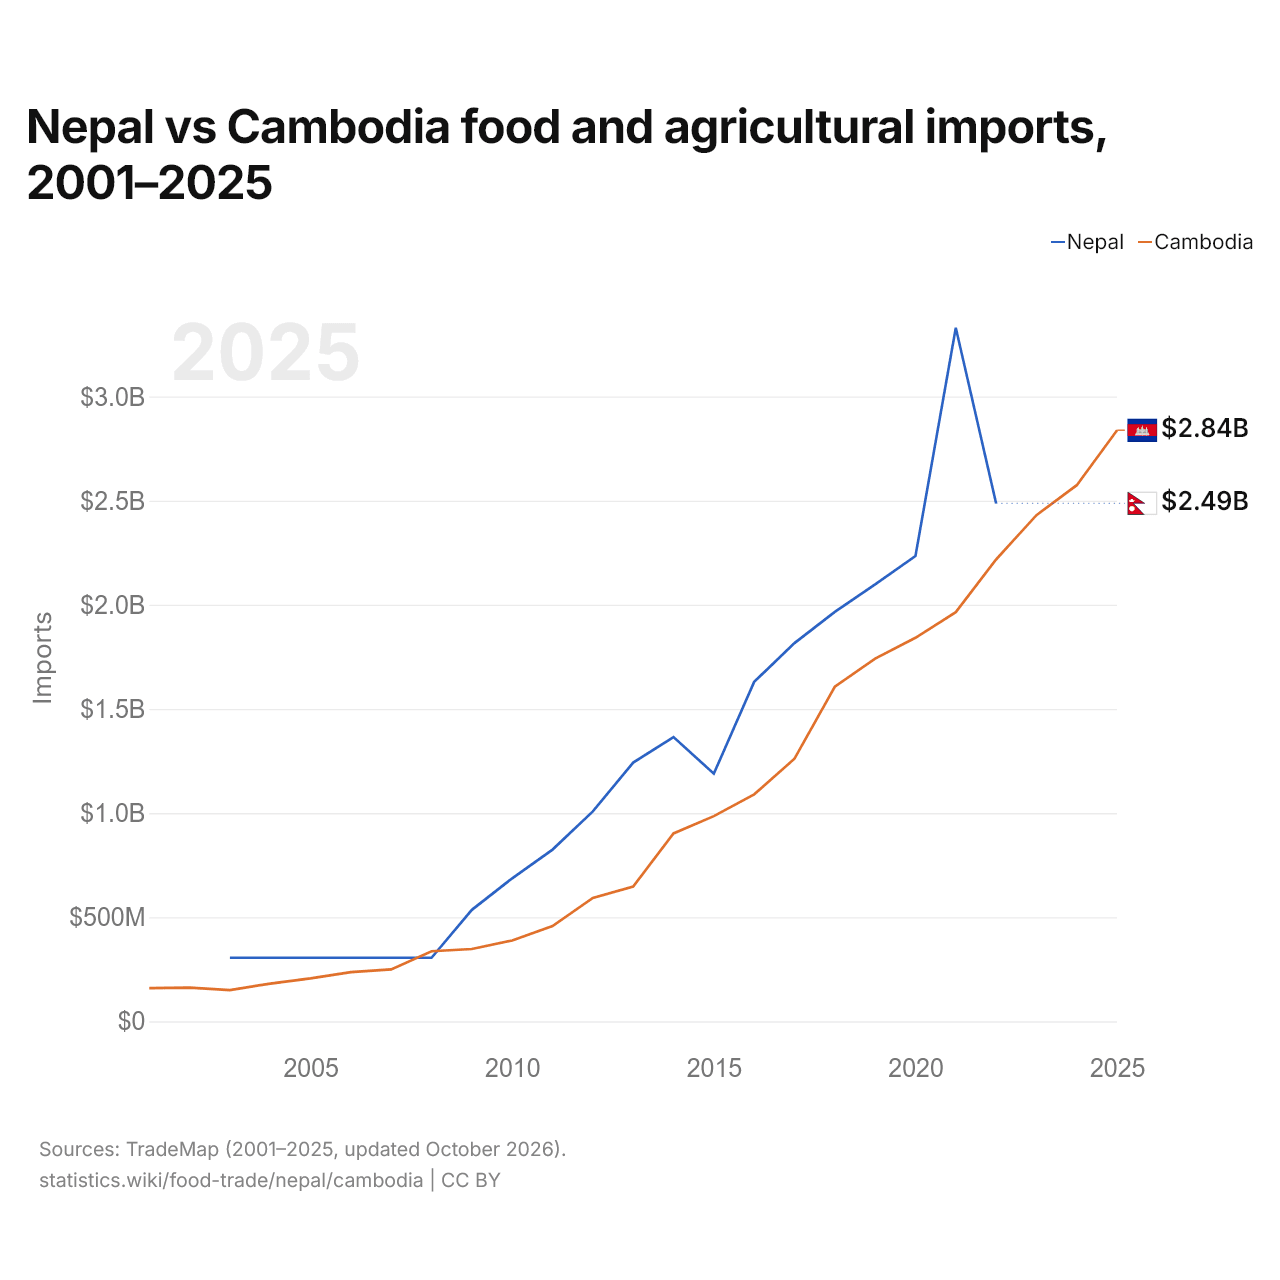
Las importaciones de alimentos y productos agrícolas de Nepal fueron de 2,49 mil millones de US$ (2022) y las de Camboya, de 2,22 mil millones de US$ (2022): las de Nepal fueron un 12 % mayores. En 2003, las importaciones de Nepal fueron 2,0 veces mayores: 305 millones de US$ de Nepal y 150 millones de US$ de Camboya.
Nepal vs Camboya: cifras del comercio de alimentos y productos agrícolas
|
Nepal
|
Camboya
|
|
|---|---|---|
| Exportaciones | 662 M US$ (2022) | 4120 M US$ (2025) |
| Importaciones | 2490 M US$ (2022) | 2840 M US$ (2025) |
| Saldo | −1820 M US$ (2022) | +1280 M US$ (2025) |
| Porcentaje del mundo | 0,03 % | 0,18 % |
| Puesto mundial | n/d | 66/171 |
| Principal comprador | India (91,3 %, 2022) | Vietnam (61,3 %, 2025) |
| Principal proveedor | India (46,6 %, 2022) | China (19,2 %, 2025) |
Comparar el comercio de alimentos y productos agrícolas de 2 países cualesquiera
Fuentes:
- TradeMap (2001–2025, actualizado en octubre de 2026)
Creative Commons Atribución (CC BY): puedes copiar, compartir, adaptar y reutilizar este contenido, también con fines comerciales, siempre que cites a statistics.wiki e indiques los cambios que hayas hecho. Las fuentes indicadas arriba pueden tener sus propias condiciones de licencia.