
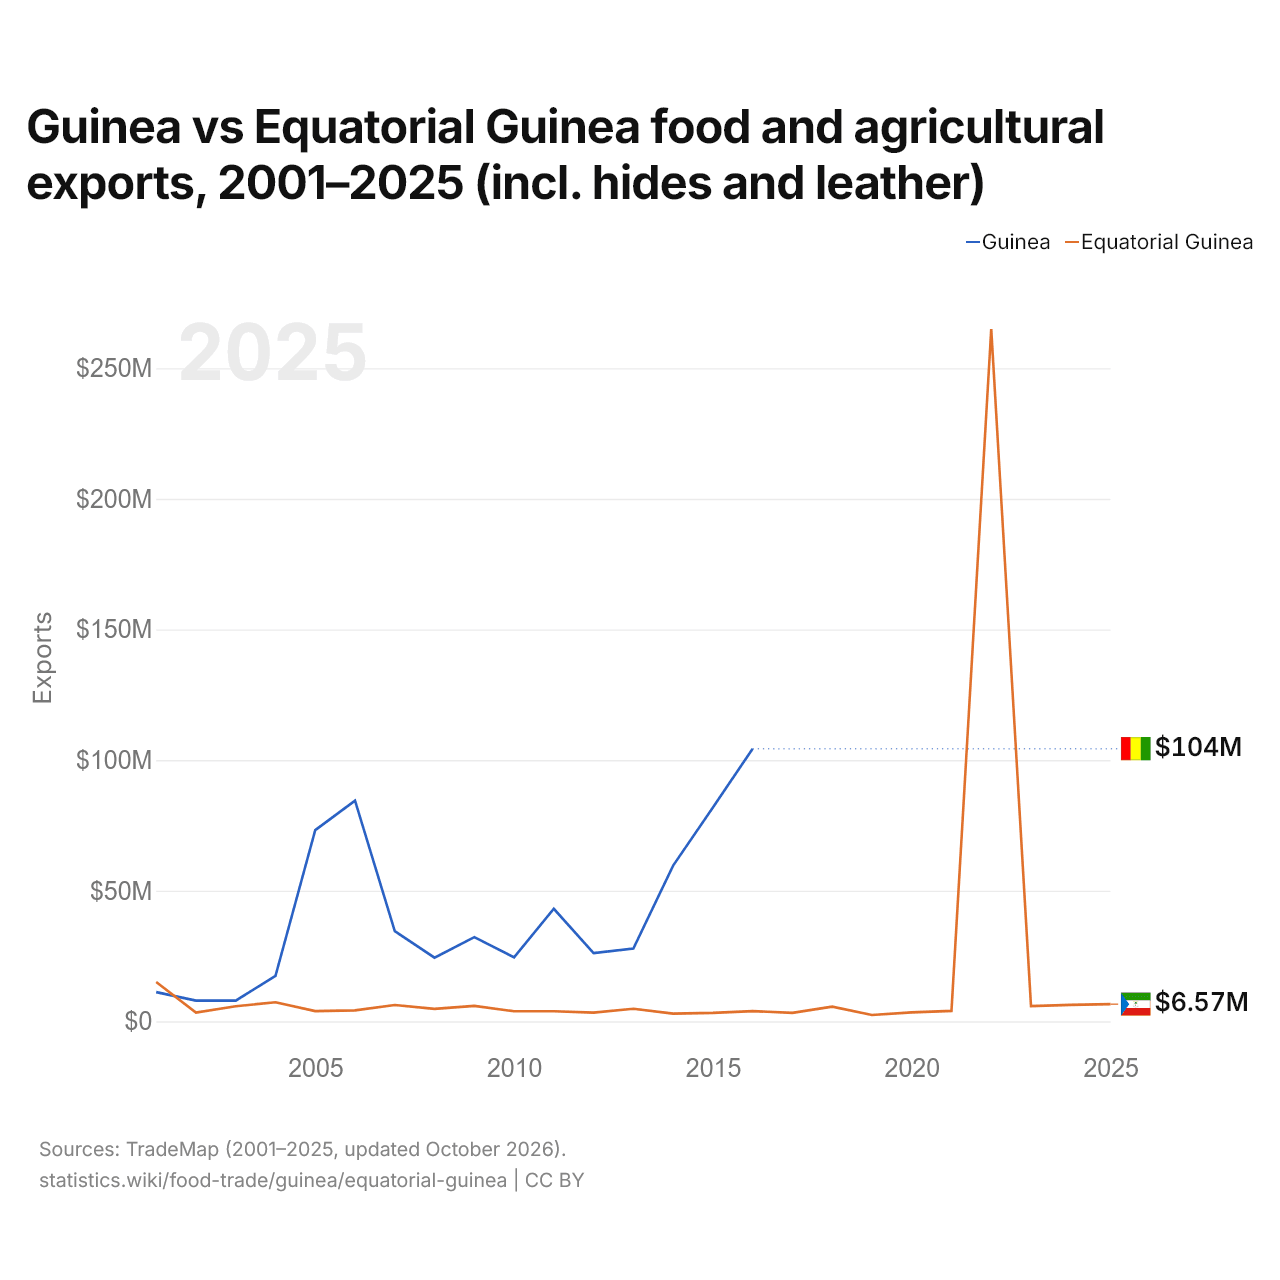
Guinea vs Guinea Ecuatorial: exportaciones de alimentos y productos agrícolas, 2001–2025 (incluye cueros y pieles)
| Año | Exportaciones | |
|---|---|---|
 Guinea |
 Guinea Ecuatorial |
|
| 2025 | - | 6.574.000 US$ |
| 2024 | - | 6.272.000 US$ |
| 2023 | - | 5.820.000 US$ |
| 2022 | - | 265.016.000 US$ |
| 2021 | - | 4.006.000 US$ |
| 2020 | - | 3.418.000 US$ |
| 2019 | - | 2.429.000 US$ |
| 2018 | - | 5.628.000 US$ |
| 2017 | - | 3.260.000 US$ |
| 2016 | 104.342.000 US$ | 3.908.000 US$ |
| 2015 | 81.881.000 US$ | 3.225.000 US$ |
| 2014 | 59.617.000 US$ | 2.955.000 US$ |
| 2013 | 27.868.000 US$ | 4.825.000 US$ |
| 2012 | 26.112.000 US$ | 3.308.000 US$ |
| 2011 | 43.099.000 US$ | 3.873.000 US$ |
| 2010 | 24.473.000 US$ | 3.850.000 US$ |
| 2009 | 32.232.000 US$ | 5.888.000 US$ |
| 2008 | 24.362.000 US$ | 4.756.000 US$ |
| 2007 | 34.512.000 US$ | 6.237.000 US$ |
| 2006 | 84.510.000 US$ | 4.212.000 US$ |
| 2005 | 73.209.000 US$ | 3.922.000 US$ |
| 2004 | 17.432.000 US$ | 7.307.000 US$ |
| 2003 | 7.923.000 US$ | 5.766.000 US$ |
| 2002 | 7.923.000 US$ | 3.357.000 US$ |
| 2001 | 11.184.000 US$ | 15.056.000 US$ |
Las exportaciones de alimentos y productos agrícolas de Guinea son de 104 millones de US$ (2016), y las de Guinea Ecuatorial, de 6,57 millones de US$ (2025). En 2001, las exportaciones de Guinea Ecuatorial fueron un 35 % mayores: 11,2 millones de US$ de Guinea y 15,1 millones de US$ de Guinea Ecuatorial.
Las exportaciones de alimentos y productos agrícolas de Guinea han sido mayores que las de Guinea Ecuatorial todos los años desde 2002.
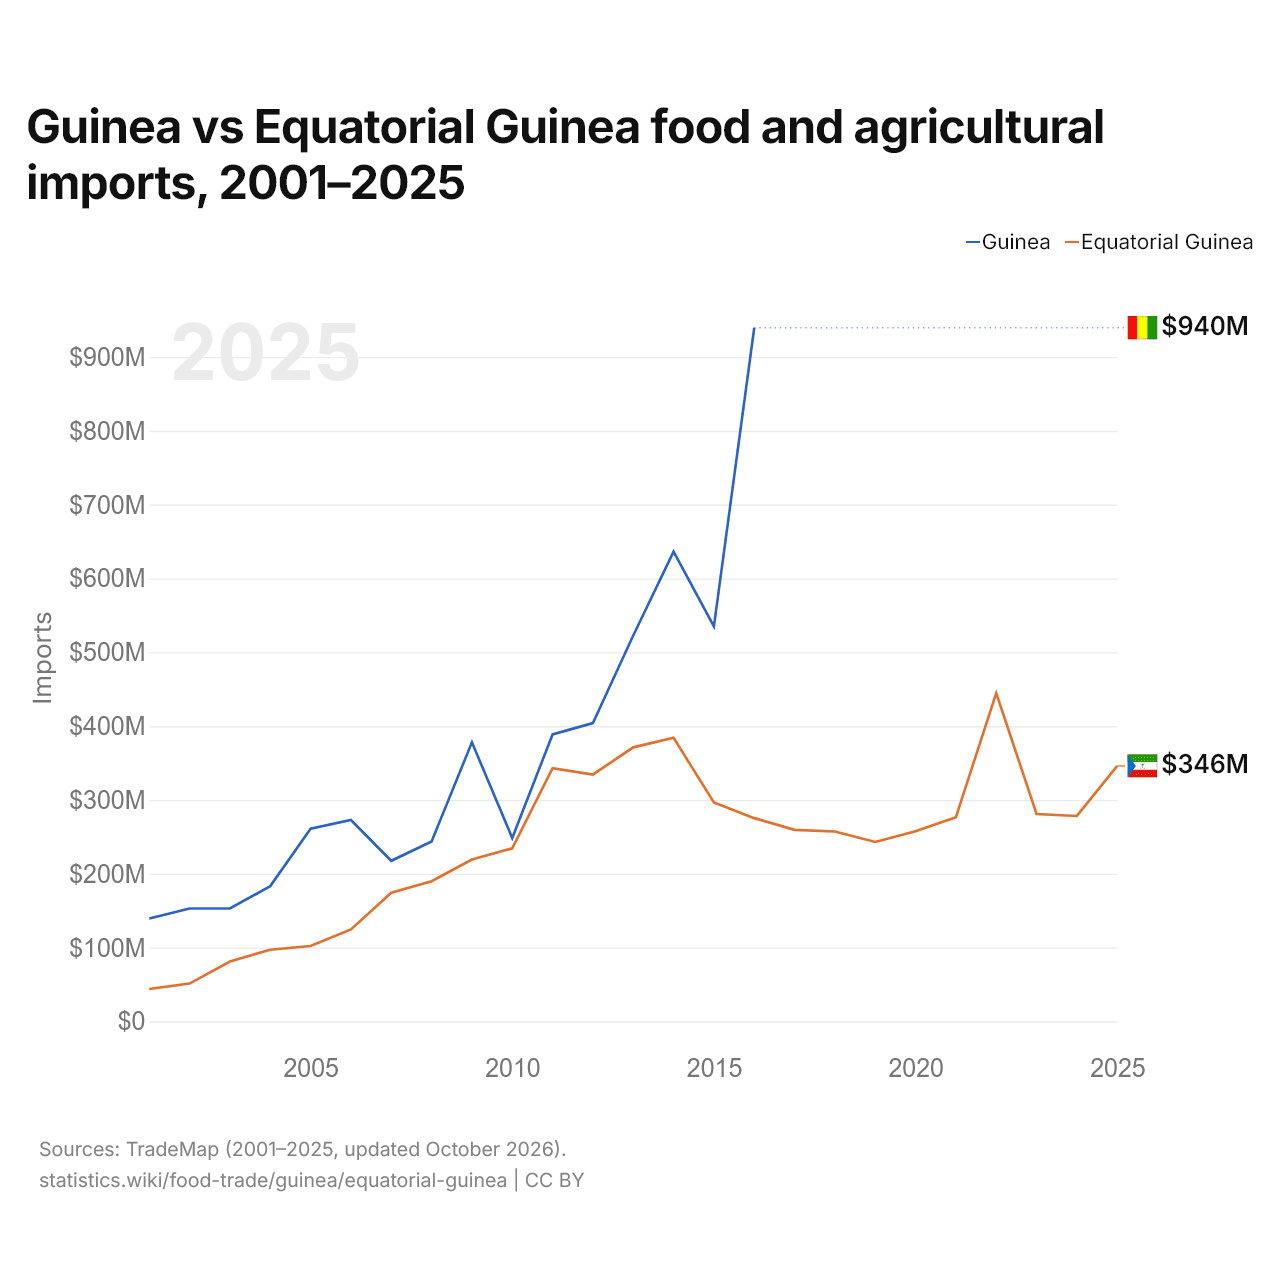
Guinea vs Guinea Ecuatorial: importaciones de alimentos y productos agrícolas, 2001–2025
| Año | Importaciones | |
|---|---|---|
|
Guinea
|
Guinea Ecuatorial
|
|
| 2025 | - | 346.019.000 US$ |
| 2024 | - | 278.191.000 US$ |
| 2023 | - | 280.820.000 US$ |
| 2022 | - | 444.754.000 US$ |
| 2021 | - | 276.470.000 US$ |
| 2020 | - | 257.507.000 US$ |
| 2019 | - | 242.972.000 US$ |
| 2018 | - | 257.119.000 US$ |
| 2017 | - | 259.349.000 US$ |
| 2016 | 939.617.000 US$ | 275.275.000 US$ |
| 2015 | 534.886.000 US$ | 296.490.000 US$ |
| 2014 | 636.262.000 US$ | 384.142.000 US$ |
| 2013 | 522.729.000 US$ | 371.190.000 US$ |
| 2012 | 403.969.000 US$ | 334.401.000 US$ |
| 2011 | 388.740.000 US$ | 342.875.000 US$ |
| 2010 | 248.373.000 US$ | 234.371.000 US$ |
| 2009 | 378.036.000 US$ | 219.266.000 US$ |
| 2008 | 243.579.000 US$ | 189.858.000 US$ |
| 2007 | 217.446.000 US$ | 174.255.000 US$ |
| 2006 | 272.655.000 US$ | 124.549.000 US$ |
| 2005 | 261.049.000 US$ | 102.107.000 US$ |
| 2004 | 183.135.000 US$ | 96.991.000 US$ |
| 2003 | 152.858.000 US$ | 81.055.000 US$ |
| 2002 | 152.858.000 US$ | 51.172.000 US$ |
| 2001 | 139.269.000 US$ | 43.771.000 US$ |
Las importaciones de alimentos y productos agrícolas de Guinea son de 940 millones de US$ (2016), y las de Guinea Ecuatorial, de 346 millones de US$ (2025). En 2001, las importaciones de Guinea fueron 3,2 veces mayores: 139 millones de US$ de Guinea y 43,8 millones de US$ de Guinea Ecuatorial.
Guinea vs Guinea Ecuatorial: cifras del comercio de alimentos y productos agrícolas
|
Guinea
|
Guinea Ecuatorial
|
|
|---|---|---|
| Exportaciones | 104 M US$ (2016) | 6,57 M US$ (2025) |
| Importaciones | 940 M US$ (2016) | 346 M US$ (2025) |
| Saldo | −835 M US$ (2016) | −339 M US$ (2025) |
| Porcentaje del mundo | 0,007 % | <0,001 % |
| Puesto mundial | n/d | 166/171 |
| Principal comprador | India (24,1 %, 2016) | España (69,5 %, 2025) |
| Principal proveedor | Emiratos Árabes Unidos (47 %, 2016) | España (22,8 %, 2025) |
Comparar el comercio de alimentos y productos agrícolas de 2 países cualesquiera
Fuentes:
- TradeMap (2001–2025, actualizado en octubre de 2026)
Creative Commons Atribución (CC BY): puedes copiar, compartir, adaptar y reutilizar este contenido, también con fines comerciales, siempre que cites a statistics.wiki e indiques los cambios que hayas hecho. Las fuentes indicadas arriba pueden tener sus propias condiciones de licencia.