
Portugal vs Argentina: exportaciones de bienes y servicios por año (US$), 1960–2025
| Año | US$ | |
|---|---|---|
 Portugal |
 Argentina |
|
| 2025 | 151.336.322.847 US$ | 106.260.393.151 US$ |
| 2024 | 143.716.598.546 US$ | 97.349.127.043 US$ |
| 2023 | 137.846.682.522 US$ | 83.276.004.575 US$ |
| 2022 | 127.117.787.017 US$ | 103.224.756.800 US$ |
| 2021 | 106.387.190.475 US$ | 87.906.118.245 US$ |
| 2020 | 85.546.804.978 US$ | 64.053.810.078 US$ |
| 2019 | 104.818.126.822 US$ | 80.259.482.469 US$ |
| 2018 | 105.740.319.070 US$ | 75.766.598.613 US$ |
| 2017 | 94.844.484.378 US$ | 72.860.557.903 US$ |
| 2016 | 83.254.740.237 US$ | 69.842.604.407 US$ |
| 2015 | 80.984.130.312 US$ | 63.671.789.069 US$ |
| 2014 | 92.457.300.369 US$ | 75.818.867.911 US$ |
| 2013 | 89.682.537.232 US$ | 80.690.471.898 US$ |
| 2012 | 81.685.225.652 US$ | 88.655.850.854 US$ |
| 2011 | 84.455.064.293 US$ | 97.809.980.731 US$ |
| 2010 | 71.598.934.533 US$ | 80.208.867.996 US$ |
| 2009 | 66.778.989.702 US$ | 65.133.480.388 US$ |
| 2008 | 82.346.807.429 US$ | 79.762.958.392 US$ |
| 2007 | 75.020.812.081 US$ | 65.162.321.195 US$ |
| 2006 | 63.373.039.604 US$ | 53.550.250.227 US$ |
| 2005 | 53.424.570.458 US$ | 46.198.180.131 US$ |
| 2004 | 52.396.449.477 US$ | 39.266.996.606 US$ |
| 2003 | 45.217.764.525 US$ | 33.084.505.278 US$ |
| 2002 | 36.493.691.735 US$ | 27.736.610.298 US$ |
| 2001 | 33.364.915.450 US$ | 31.112.418.400 US$ |
| 2000 | 33.452.144.656 US$ | 31.223.690.400 US$ |
| 1999 | 33.756.675.285 US$ | 27.862.300.000 US$ |
| 1998 | 33.876.548.308 US$ | 31.137.200.000 US$ |
| 1997 | 31.774.839.337 US$ | 30.928.400.000 US$ |
| 1996 | 32.556.406.291 US$ | 28.381.400.000 US$ |
| 1995 | 31.620.944.673 US$ | 24.978.532.000 US$ |
| 1994 | 25.055.310.386 US$ | 19.385.100.000 US$ |
| 1993 | 22.422.442.339 US$ | 16.357.317.317 US$ |
| 1992 | 26.315.596.971 US$ | 15.095.261.860 US$ |
| 1991 | 23.689.342.306 US$ | 14.561.091.033 US$ |
| 1990 | 22.960.185.628 US$ | 14.643.479.947 US$ |
| 1989 | 17.854.164.757 US$ | 10.006.623.327 US$ |
| 1988 | 15.572.504.178 US$ | 12.094.686.105 US$ |
| 1987 | 13.172.520.279 US$ | 8.566.904.947 US$ |
| 1986 | 10.071.952.821 US$ | 8.641.279.278 US$ |
| 1985 | 7.929.289.328 US$ | 10.345.475.059 US$ |
| 1984 | 7.358.490.824 US$ | 8.873.730.059 US$ |
| 1983 | 6.687.714.441 US$ | 9.515.669.467 US$ |
| 1982 | 6.314.253.280 US$ | 7.663.966.256 US$ |
| 1981 | 6.501.188.925 US$ | 5.445.263.190 US$ |
| 1980 | 7.058.033.640 US$ | 3.895.791.555 US$ |
| 1979 | 5.643.155.738 US$ | 4.508.960.597 US$ |
| 1978 | 3.702.002.737 US$ | 7.665.724.160 US$ |
| 1977 | 3.094.730.225 US$ | 5.459.999.881 US$ |
| 1976 | 2.777.320.955 US$ | 4.695.000.304 US$ |
| 1975 | 3.092.305.882 US$ | 3.054.054.017 US$ |
| 1974 | 3.686.495.659 US$ | 4.999.999.840 US$ |
| 1973 | 3.160.024.530 US$ | 4.000.000.136 US$ |
| 1972 | 2.398.176.427 US$ | 2.500.000.047 US$ |
| 1971 | 1.808.141.343 US$ | 2.000.000.003 US$ |
| 1970 | 1.549.504.881 US$ | 1.769.210.603 US$ |
| 1969 | - | 2.000.000.041 US$ |
| 1968 | - | 1.714.285.705 US$ |
| 1967 | - | 1.818.181.858 US$ |
| 1966 | - | 1.904.761.830 US$ |
| 1965 | - | 1.764.705.803 US$ |
| 1964 | - | 1.424.603.255 US$ |
| 1963 | - | 1.441.753.550 US$ |
| 1962 | - | 860.375.634 US$ |
| 1961 | - | 1.206.915.940 US$ |
| 1960 | - | 1.206.418.458 US$ |
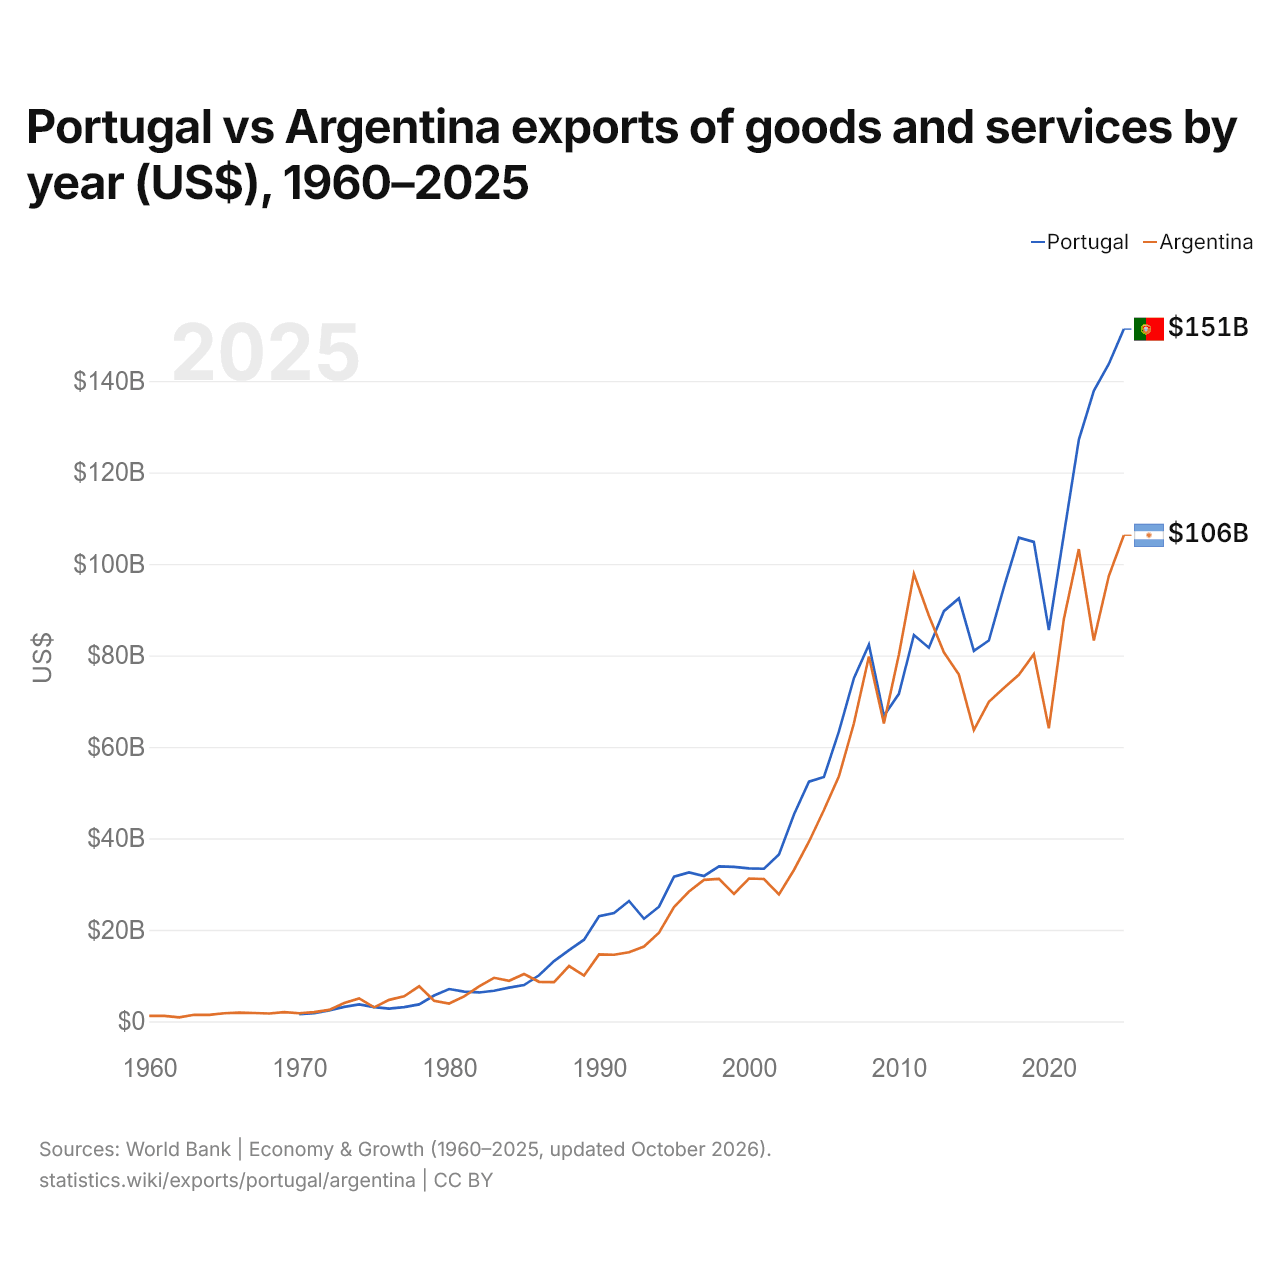
En 2025, las exportaciones de bienes y servicios de Portugal fueron de 151 mil millones de US$ y las de Argentina, de 106 mil millones de US$: las de Portugal fueron un 42 % mayores. En 1970, las exportaciones de Argentina fueron un 14 % mayores: 1,55 mil millones de US$ de Portugal y 1,77 mil millones de US$ de Argentina.
Las exportaciones de bienes y servicios de Portugal han sido mayores que las de Argentina todos los años desde 2013.
Exportaciones de bienes entre Portugal y Argentina, según declara el exportador (US$), 2001–2025
| Año | US$ | |
|---|---|---|
| Portugal → Argentina | Argentina → Portugal | |
| 2025 | 39.510.000 US$ | 210.151.000 US$ |
| 2024 | 64.875.000 US$ | 146.045.000 US$ |
| 2023 | 50.107.000 US$ | 111.324.000 US$ |
| 2022 | 140.651.000 US$ | 181.186.000 US$ |
| 2021 | 111.514.000 US$ | 140.194.000 US$ |
| 2020 | 74.310.000 US$ | 84.670.000 US$ |
| 2019 | 47.565.000 US$ | 99.859.000 US$ |
| 2018 | 139.077.000 US$ | 68.896.000 US$ |
| 2017 | 93.689.000 US$ | 95.967.000 US$ |
| 2016 | 92.022.000 US$ | 116.029.000 US$ |
| 2015 | 100.492.000 US$ | 46.069.000 US$ |
| 2014 | 67.589.000 US$ | 55.578.000 US$ |
| 2013 | 118.858.000 US$ | 58.294.000 US$ |
| 2012 | 68.267.000 US$ | 71.802.000 US$ |
| 2011 | 62.934.000 US$ | 118.387.000 US$ |
| 2010 | 68.834.000 US$ | 87.389.000 US$ |
| 2009 | 41.649.000 US$ | 121.280.000 US$ |
| 2008 | 50.732.000 US$ | 334.229.000 US$ |
| 2007 | 81.139.000 US$ | 192.929.000 US$ |
| 2006 | 61.505.000 US$ | 79.613.000 US$ |
| 2005 | 44.719.000 US$ | 120.725.000 US$ |
| 2004 | 36.613.000 US$ | 131.574.000 US$ |
| 2003 | 29.284.000 US$ | 135.941.000 US$ |
| 2002 | 24.526.000 US$ | 130.669.000 US$ |
| 2001 | 49.108.000 US$ | 134.684.000 US$ |
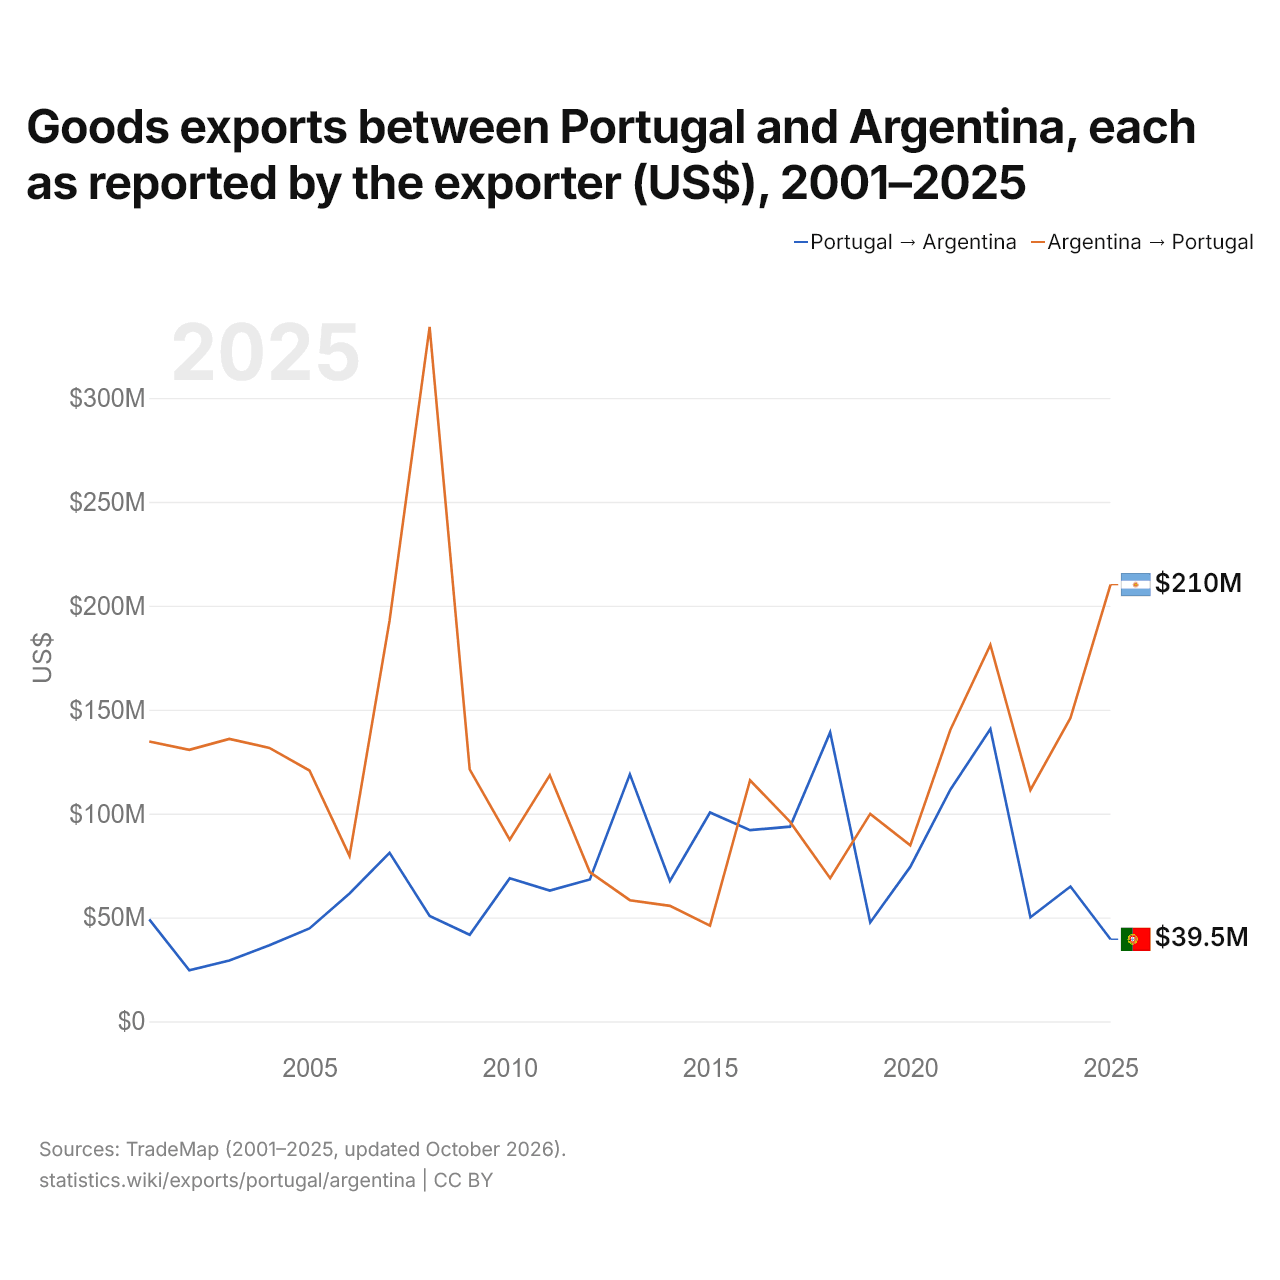
En 2025, las exportaciones de bienes de Portugal hacia Argentina, según Portugal, fueron de 39,5 millones de US$, y las de Argentina hacia Portugal, según Argentina, de 210 millones de US$: 5,3 veces más desde Argentina. En 2001, fueron de 49,1 millones de US$ desde Portugal y de 135 millones de US$ desde Argentina.
Portugal vs Argentina: cifras de exportaciones
|
Portugal
|
Argentina
|
|
|---|---|---|
| Exportaciones | 151 mil M US$ (2025) | 106 mil M US$ (2025) |
| Puesto mundial | 39/176 | 47/176 |
| Porcentaje del mundo | 0,43 % | 0,3 % |
| % del PIB | 43,7 % | 15,6 % |
| Mayor categoría de bienes | Maquinaria, electrónica y vehículos (31,6 %, 2025) | Alimentos elaborados, aceites, piensos, bebidas y tabaco (25,6 %, 2025) |
| Principal destino de bienes | España (26 %, 2025) | Brasil (14,7 %, 2025) |
Comparar las exportaciones de 2 países cualesquiera
Fuentes:
- Banco Mundial | Economía y crecimiento (1960–2025, actualizado en octubre de 2026)
- TradeMap (2001–2025, actualizado en octubre de 2026)
Creative Commons Atribución (CC BY): puedes copiar, compartir, adaptar y reutilizar este contenido, también con fines comerciales, siempre que cites a statistics.wiki e indiques los cambios que hayas hecho. Las fuentes indicadas arriba pueden tener sus propias condiciones de licencia.