
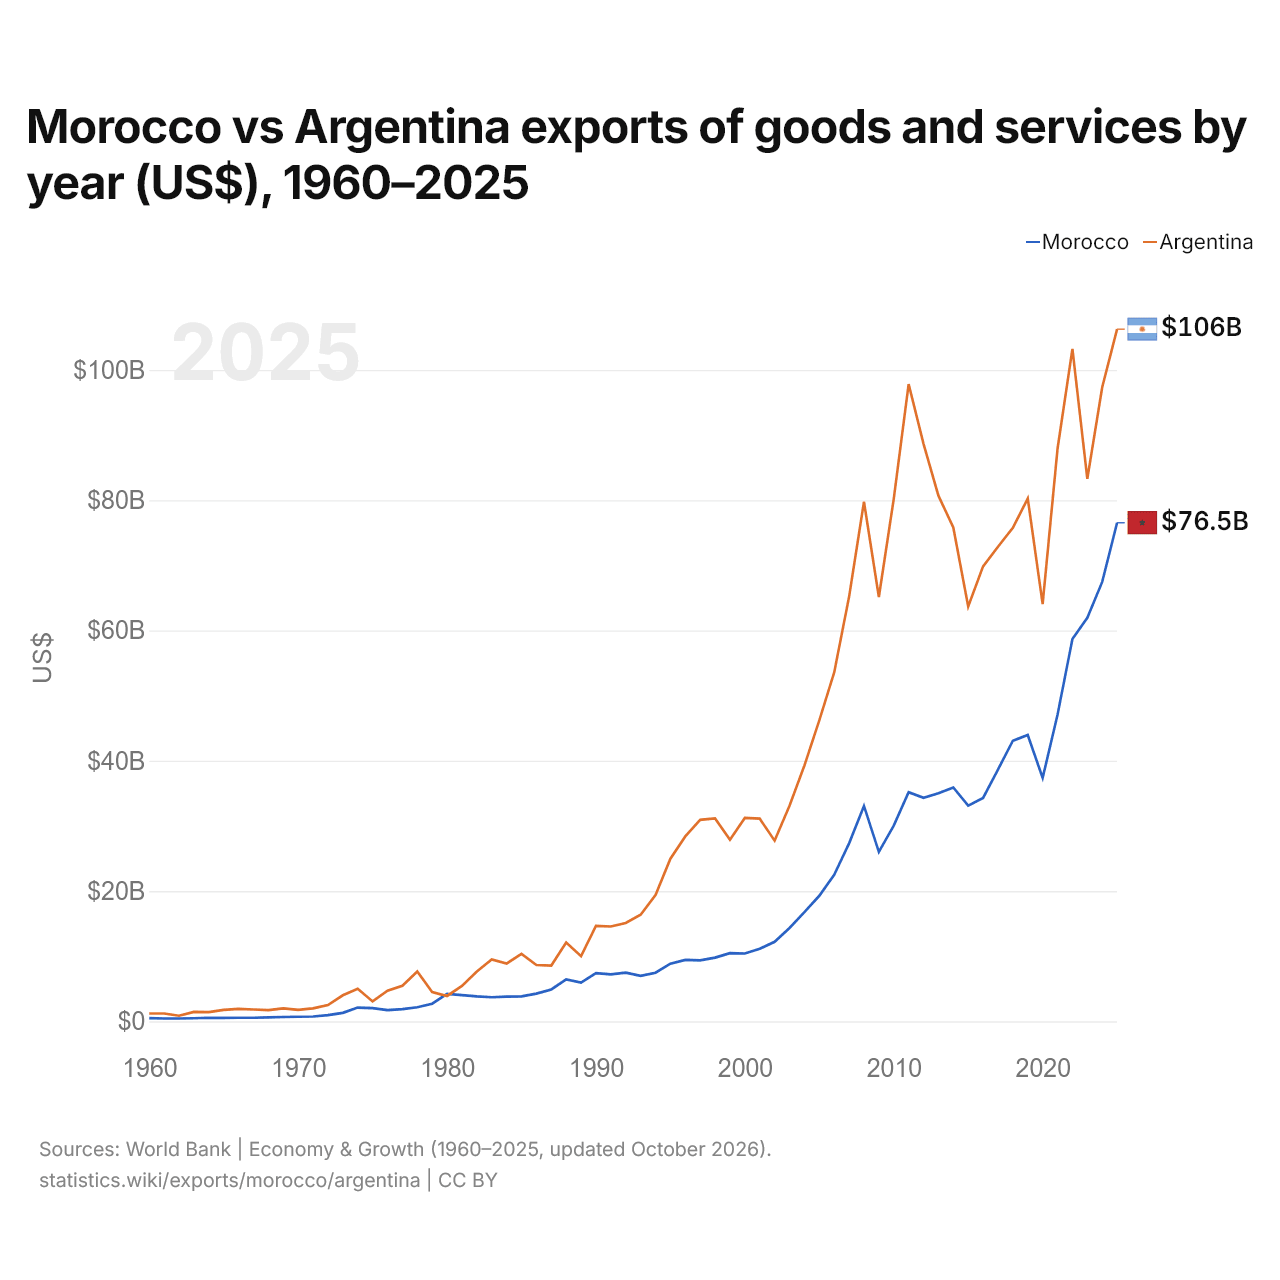
Marruecos vs Argentina: exportaciones de bienes y servicios por año (US$), 1960–2025
| Año | US$ | |
|---|---|---|
 Marruecos |
 Argentina |
|
| 2025 | 76.541.039.368 US$ | 106.260.393.151 US$ |
| 2024 | 67.454.245.753 US$ | 97.349.127.043 US$ |
| 2023 | 61.945.010.973 US$ | 83.276.004.575 US$ |
| 2022 | 58.681.916.332 US$ | 103.224.756.800 US$ |
| 2021 | 47.060.549.921 US$ | 87.906.118.245 US$ |
| 2020 | 37.369.771.251 US$ | 64.053.810.078 US$ |
| 2019 | 43.952.860.516 US$ | 80.259.482.469 US$ |
| 2018 | 43.077.520.359 US$ | 75.766.598.613 US$ |
| 2017 | 38.651.885.813 US$ | 72.860.557.903 US$ |
| 2016 | 34.291.493.550 US$ | 69.842.604.407 US$ |
| 2015 | 33.119.569.274 US$ | 63.671.789.069 US$ |
| 2014 | 35.897.680.524 US$ | 75.818.867.911 US$ |
| 2013 | 35.014.914.037 US$ | 80.690.471.898 US$ |
| 2012 | 34.323.797.625 US$ | 88.655.850.854 US$ |
| 2011 | 35.175.698.018 US$ | 97.809.980.731 US$ |
| 2010 | 30.046.721.233 US$ | 80.208.867.996 US$ |
| 2009 | 26.014.198.657 US$ | 65.133.480.388 US$ |
| 2008 | 33.064.161.825 US$ | 79.762.958.392 US$ |
| 2007 | 27.325.793.519 US$ | 65.162.321.195 US$ |
| 2006 | 22.483.592.810 US$ | 53.550.250.227 US$ |
| 2005 | 19.275.921.048 US$ | 46.198.180.131 US$ |
| 2004 | 16.759.410.599 US$ | 39.266.996.606 US$ |
| 2003 | 14.319.608.062 US$ | 33.084.505.278 US$ |
| 2002 | 12.213.885.546 US$ | 27.736.610.298 US$ |
| 2001 | 11.131.243.438 US$ | 31.112.418.400 US$ |
| 2000 | 10.408.859.646 US$ | 31.223.690.400 US$ |
| 1999 | 10.472.253.114 US$ | 27.862.300.000 US$ |
| 1998 | 9.784.229.421 US$ | 31.137.200.000 US$ |
| 1997 | 9.365.776.467 US$ | 30.928.400.000 US$ |
| 1996 | 9.424.749.951 US$ | 28.381.400.000 US$ |
| 1995 | 8.849.422.506 US$ | 24.978.532.000 US$ |
| 1994 | 7.454.972.835 US$ | 19.385.100.000 US$ |
| 1993 | 6.983.435.380 US$ | 16.357.317.317 US$ |
| 1992 | 7.474.470.438 US$ | 15.095.261.860 US$ |
| 1991 | 7.205.742.183 US$ | 14.561.091.033 US$ |
| 1990 | 7.411.991.822 US$ | 14.643.479.947 US$ |
| 1989 | 5.935.176.840 US$ | 10.006.623.327 US$ |
| 1988 | 6.425.436.406 US$ | 12.094.686.105 US$ |
| 1987 | 4.893.088.773 US$ | 8.566.904.947 US$ |
| 1986 | 4.258.765.117 US$ | 8.641.279.278 US$ |
| 1985 | 3.824.760.012 US$ | 10.345.475.059 US$ |
| 1984 | 3.800.181.964 US$ | 8.873.730.059 US$ |
| 1983 | 3.697.958.875 US$ | 9.515.669.467 US$ |
| 1982 | 3.822.370.232 US$ | 7.663.966.256 US$ |
| 1981 | 4.032.797.040 US$ | 5.445.263.190 US$ |
| 1980 | 4.201.411.557 US$ | 3.895.791.555 US$ |
| 1979 | 2.706.652.298 US$ | 4.508.960.597 US$ |
| 1978 | 2.167.005.746 US$ | 7.665.724.160 US$ |
| 1977 | 1.866.967.362 US$ | 5.459.999.881 US$ |
| 1976 | 1.717.031.972 US$ | 4.695.000.304 US$ |
| 1975 | 2.019.155.151 US$ | 3.054.054.017 US$ |
| 1974 | 2.115.101.331 US$ | 4.999.999.840 US$ |
| 1973 | 1.300.658.084 US$ | 4.000.000.136 US$ |
| 1972 | 942.466.528 US$ | 2.500.000.047 US$ |
| 1971 | 738.600.056 US$ | 2.000.000.003 US$ |
| 1970 | 697.778.278 US$ | 1.769.210.603 US$ |
| 1969 | 671.081.259 US$ | 2.000.000.041 US$ |
| 1968 | 604.684.527 US$ | 1.714.285.705 US$ |
| 1967 | 545.401.730 US$ | 1.818.181.858 US$ |
| 1966 | 545.401.730 US$ | 1.904.761.830 US$ |
| 1965 | 535.521.264 US$ | 1.764.705.803 US$ |
| 1964 | 545.401.671 US$ | 1.424.603.255 US$ |
| 1963 | 476.238.487 US$ | 1.441.753.550 US$ |
| 1962 | 428.812.249 US$ | 860.375.634 US$ |
| 1961 | 440.668.809 US$ | 1.206.915.940 US$ |
| 1960 | 480.190.673 US$ | 1.206.418.458 US$ |
En 2025, las exportaciones de bienes y servicios de Marruecos fueron de 76,5 mil millones de US$ y las de Argentina, de 106 mil millones de US$: las de Argentina fueron un 39 % mayores. En 1960, las exportaciones de Argentina fueron 2,5 veces mayores: 480 millones de US$ de Marruecos y 1,21 mil millones de US$ de Argentina.
Las exportaciones de bienes y servicios de Argentina han sido mayores que las de Marruecos todos los años desde 1981.
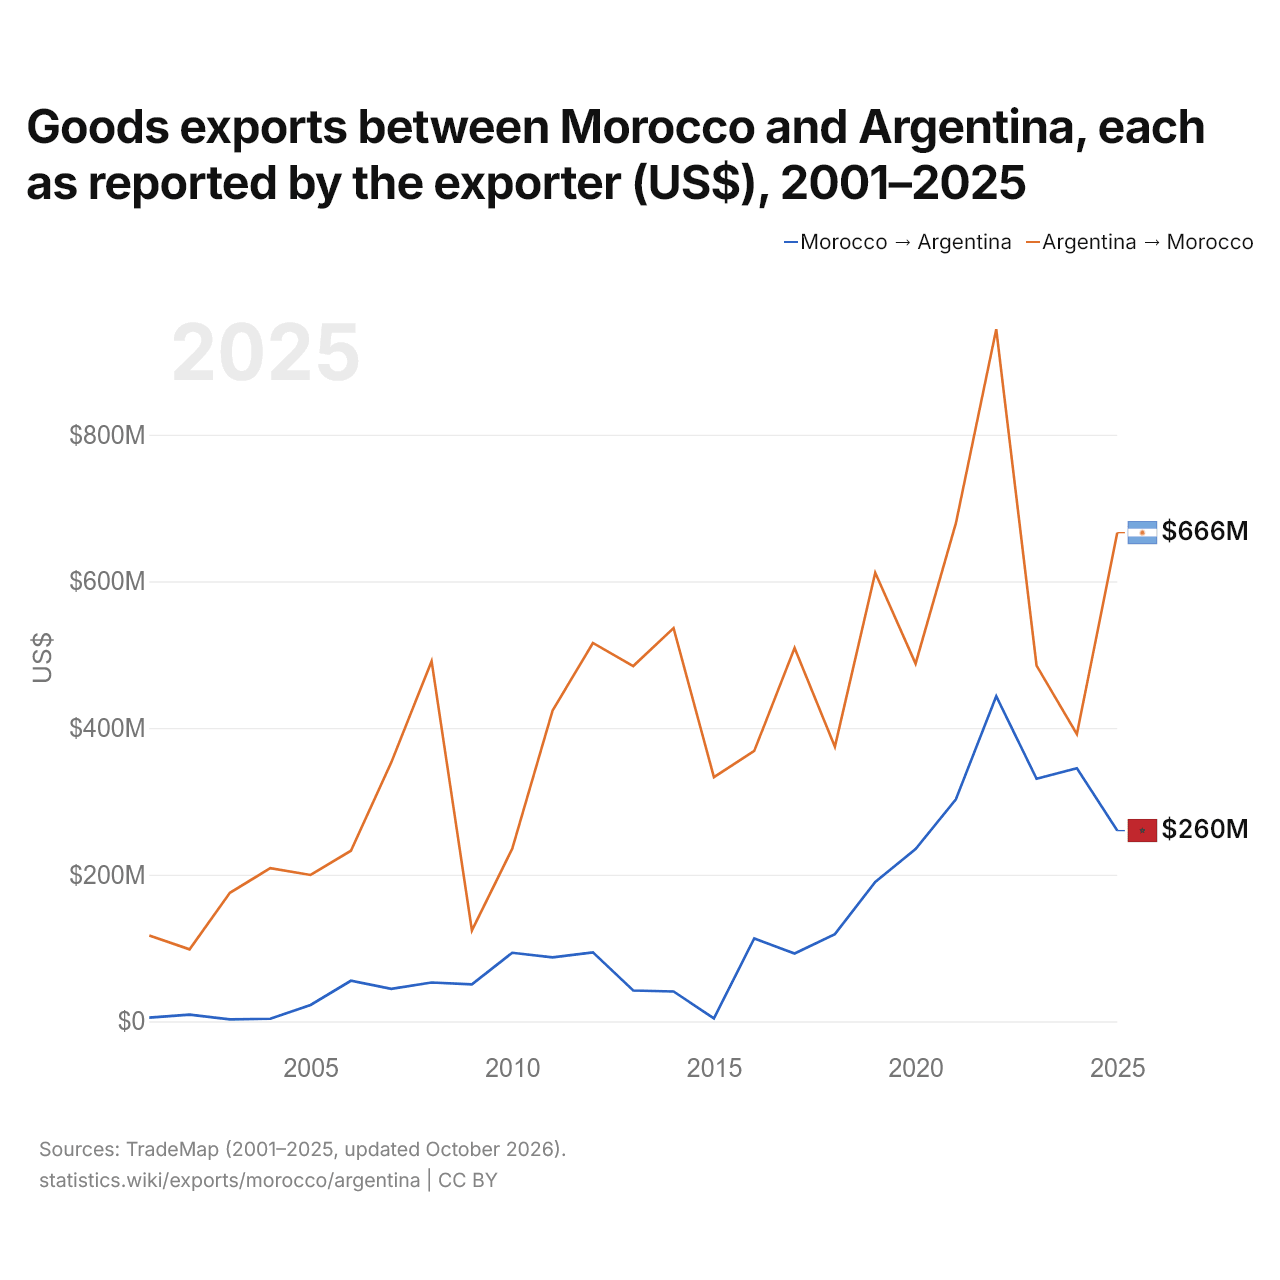
Exportaciones de bienes entre Marruecos y Argentina, según declara el exportador (US$), 2001–2025
| Año | US$ | |
|---|---|---|
| Marruecos → Argentina | Argentina → Marruecos | |
| 2025 | 260.097.000 US$ | 666.413.000 US$ |
| 2024 | 345.095.000 US$ | 391.532.000 US$ |
| 2023 | 330.765.000 US$ | 485.161.000 US$ |
| 2022 | 443.504.000 US$ | 943.938.000 US$ |
| 2021 | 302.822.000 US$ | 679.274.000 US$ |
| 2020 | 234.971.000 US$ | 487.799.000 US$ |
| 2019 | 190.010.000 US$ | 611.691.000 US$ |
| 2018 | 118.911.000 US$ | 374.561.000 US$ |
| 2017 | 92.510.000 US$ | 509.121.000 US$ |
| 2016 | 113.046.000 US$ | 368.736.000 US$ |
| 2015 | 3.927.000 US$ | 333.011.000 US$ |
| 2014 | 40.736.000 US$ | 536.290.000 US$ |
| 2013 | 42.087.000 US$ | 484.526.000 US$ |
| 2012 | 94.115.000 US$ | 516.054.000 US$ |
| 2011 | 87.338.000 US$ | 423.892.000 US$ |
| 2010 | 93.493.000 US$ | 235.464.000 US$ |
| 2009 | 50.435.000 US$ | 123.898.000 US$ |
| 2008 | 52.924.000 US$ | 491.221.000 US$ |
| 2007 | 44.278.000 US$ | 353.113.000 US$ |
| 2006 | 55.323.000 US$ | 232.664.000 US$ |
| 2005 | 22.330.000 US$ | 199.615.000 US$ |
| 2004 | 3.546.000 US$ | 208.870.000 US$ |
| 2003 | 2.663.000 US$ | 175.276.000 US$ |
| 2002 | 9.038.000 US$ | 98.162.000 US$ |
| 2001 | 4.985.000 US$ | 117.073.000 US$ |
En 2025, las exportaciones de bienes de Marruecos hacia Argentina, según Marruecos, fueron de 260 millones de US$, y las de Argentina hacia Marruecos, según Argentina, de 666 millones de US$: 2,6 veces más desde Argentina. En 2001, fueron de 4,99 millones de US$ desde Marruecos y de 117 millones de US$ desde Argentina.
Marruecos vs Argentina: cifras de exportaciones
|
Marruecos
|
Argentina
|
|
|---|---|---|
| Exportaciones | 76,5 mil M US$ (2025) | 106 mil M US$ (2025) |
| Puesto mundial | 53/176 | 47/176 |
| Porcentaje del mundo | 0,22 % | 0,3 % |
| % del PIB | 42,0 % | 15,6 % |
| Mayor categoría de bienes | Maquinaria, electrónica y vehículos (39,8 %, 2025) | Alimentos elaborados, aceites, piensos, bebidas y tabaco (25,6 %, 2025) |
| Principal destino de bienes | España (21,5 %, 2025) | Brasil (14,7 %, 2025) |
Comparar las exportaciones de 2 países cualesquiera
Fuentes:
- Banco Mundial | Economía y crecimiento (1960–2025, actualizado en octubre de 2026)
- TradeMap (2001–2025, actualizado en octubre de 2026)
Creative Commons Atribución (CC BY): puedes copiar, compartir, adaptar y reutilizar este contenido, también con fines comerciales, siempre que cites a statistics.wiki e indiques los cambios que hayas hecho. Las fuentes indicadas arriba pueden tener sus propias condiciones de licencia.