
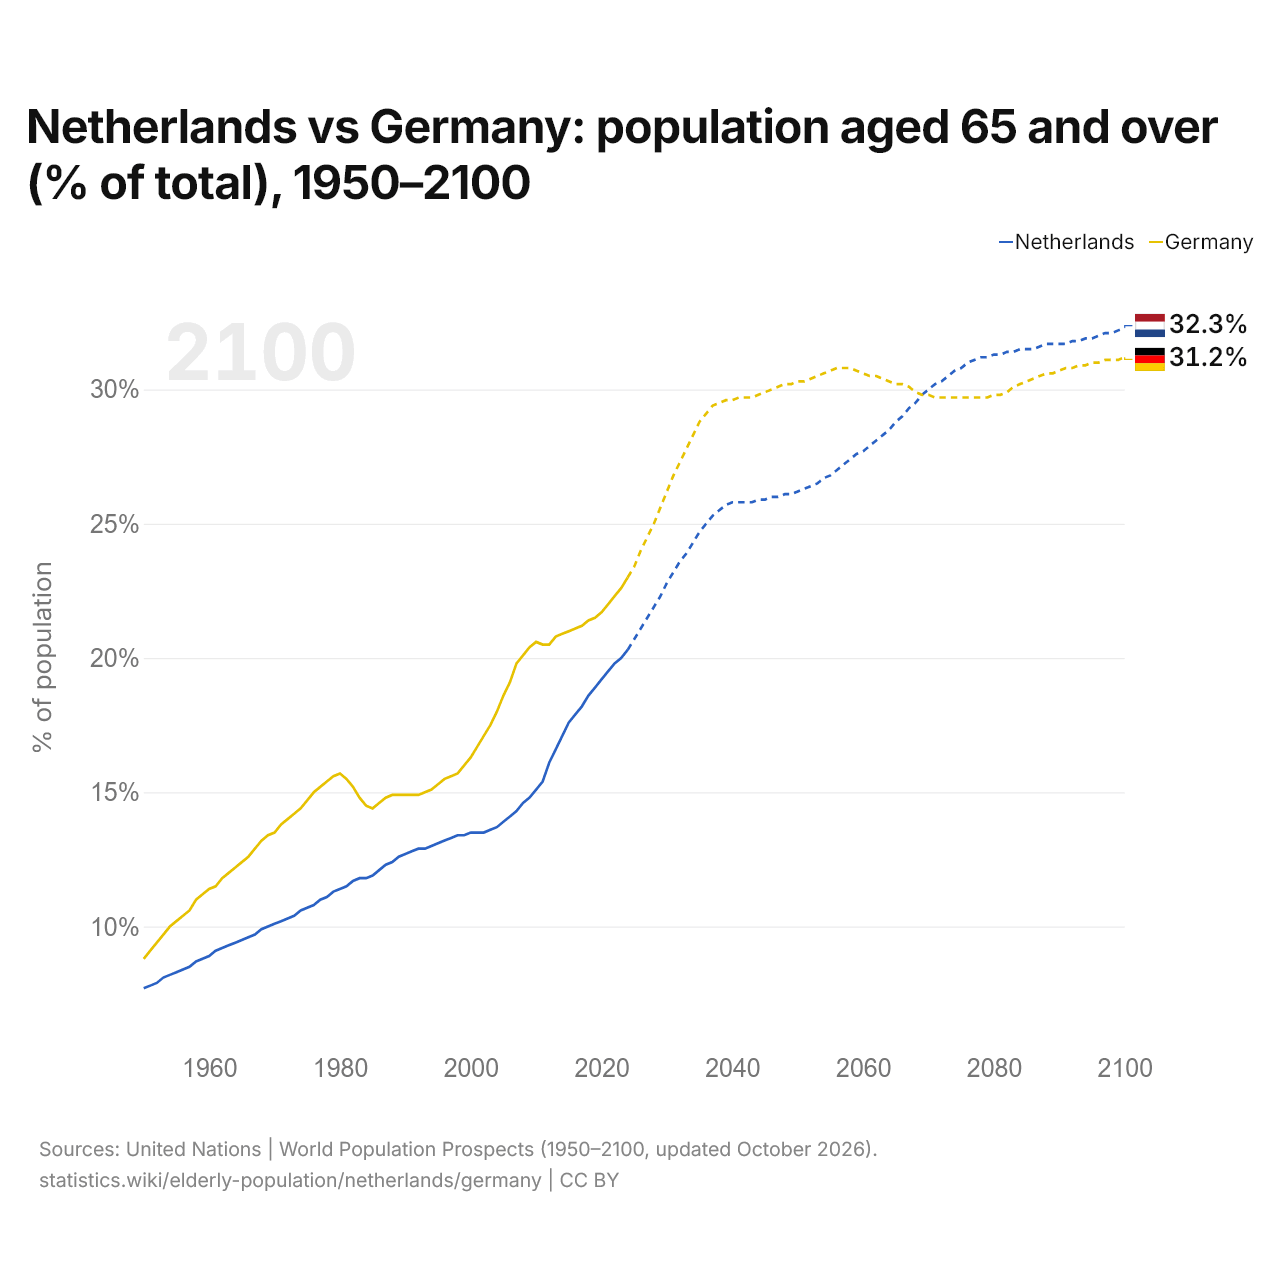
Netherlands vs Germany: population aged 65 and over (% of total), 1950–2100
| Year | % of population | |
|---|---|---|
 Netherlands |
 Germany |
|
| 2100 projected | 32.3% | 31.2% |
| 2099 projected | 32.2% | 31.1% |
| 2098 projected | 32.1% | 31.1% |
| 2097 projected | 32.1% | 31.1% |
| 2096 projected | 32% | 31% |
| 2095 projected | 31.9% | 31% |
| 2094 projected | 31.9% | 30.9% |
| 2093 projected | 31.8% | 30.9% |
| 2092 projected | 31.8% | 30.8% |
| 2091 projected | 31.7% | 30.8% |
| 2090 projected | 31.7% | 30.7% |
| 2089 projected | 31.7% | 30.6% |
| 2088 projected | 31.7% | 30.6% |
| 2087 projected | 31.6% | 30.5% |
| 2086 projected | 31.5% | 30.4% |
| 2085 projected | 31.5% | 30.3% |
| 2084 projected | 31.5% | 30.2% |
| 2083 projected | 31.4% | 30.1% |
| 2082 projected | 31.4% | 29.9% |
| 2081 projected | 31.3% | 29.8% |
| 2080 projected | 31.3% | 29.8% |
| 2079 projected | 31.2% | 29.7% |
| 2078 projected | 31.2% | 29.7% |
| 2077 projected | 31.1% | 29.7% |
| 2076 projected | 31% | 29.7% |
| 2075 projected | 30.8% | 29.7% |
| 2074 projected | 30.7% | 29.7% |
| 2073 projected | 30.5% | 29.7% |
| 2072 projected | 30.3% | 29.7% |
| 2071 projected | 30.2% | 29.7% |
| 2070 projected | 30% | 29.8% |
| 2069 projected | 29.8% | 29.8% |
| 2068 projected | 29.5% | 29.9% |
| 2067 projected | 29.3% | 30.1% |
| 2066 projected | 29% | 30.2% |
| 2065 projected | 28.8% | 30.2% |
| 2064 projected | 28.5% | 30.3% |
| 2063 projected | 28.3% | 30.4% |
| 2062 projected | 28.1% | 30.5% |
| 2061 projected | 27.9% | 30.5% |
| 2060 projected | 27.7% | 30.6% |
| 2059 projected | 27.6% | 30.7% |
| 2058 projected | 27.4% | 30.8% |
| 2057 projected | 27.2% | 30.8% |
| 2056 projected | 27% | 30.8% |
| 2055 projected | 26.8% | 30.7% |
| 2054 projected | 26.7% | 30.6% |
| 2053 projected | 26.5% | 30.5% |
| 2052 projected | 26.4% | 30.4% |
| 2051 projected | 26.3% | 30.3% |
| 2050 projected | 26.2% | 30.3% |
| 2049 projected | 26.1% | 30.2% |
| 2048 projected | 26.1% | 30.2% |
| 2047 projected | 26% | 30.1% |
| 2046 projected | 26% | 30% |
| 2045 projected | 25.9% | 29.9% |
| 2044 projected | 25.9% | 29.8% |
| 2043 projected | 25.8% | 29.7% |
| 2042 projected | 25.8% | 29.7% |
| 2041 projected | 25.8% | 29.7% |
| 2040 projected | 25.8% | 29.6% |
| 2039 projected | 25.7% | 29.6% |
| 2038 projected | 25.5% | 29.5% |
| 2037 projected | 25.3% | 29.4% |
| 2036 projected | 25% | 29.1% |
| 2035 projected | 24.7% | 28.8% |
| 2034 projected | 24.3% | 28.3% |
| 2033 projected | 23.9% | 27.8% |
| 2032 projected | 23.6% | 27.3% |
| 2031 projected | 23.2% | 26.8% |
| 2030 projected | 22.8% | 26.2% |
| 2029 projected | 22.3% | 25.6% |
| 2028 projected | 21.9% | 25% |
| 2027 projected | 21.5% | 24.5% |
| 2026 projected | 21.1% | 24% |
| 2025 projected | 20.7% | 23.4% |
| 2024 | 20.3% | 23% |
| 2023 | 20% | 22.6% |
| 2022 | 19.8% | 22.3% |
| 2021 | 19.5% | 22% |
| 2020 | 19.2% | 21.7% |
| 2019 | 18.9% | 21.5% |
| 2018 | 18.6% | 21.4% |
| 2017 | 18.2% | 21.2% |
| 2016 | 17.9% | 21.1% |
| 2015 | 17.6% | 21% |
| 2014 | 17.1% | 20.9% |
| 2013 | 16.6% | 20.8% |
| 2012 | 16.1% | 20.5% |
| 2011 | 15.4% | 20.5% |
| 2010 | 15.1% | 20.6% |
| 2009 | 14.8% | 20.4% |
| 2008 | 14.6% | 20.1% |
| 2007 | 14.3% | 19.8% |
| 2006 | 14.1% | 19.1% |
| 2005 | 13.9% | 18.6% |
| 2004 | 13.7% | 18% |
| 2003 | 13.6% | 17.5% |
| 2002 | 13.5% | 17.1% |
| 2001 | 13.5% | 16.7% |
| 2000 | 13.5% | 16.3% |
| 1999 | 13.4% | 16% |
| 1998 | 13.4% | 15.7% |
| 1997 | 13.3% | 15.6% |
| 1996 | 13.2% | 15.5% |
| 1995 | 13.1% | 15.3% |
| 1994 | 13% | 15.1% |
| 1993 | 12.9% | 15% |
| 1992 | 12.9% | 14.9% |
| 1991 | 12.8% | 14.9% |
| 1990 | 12.7% | 14.9% |
| 1989 | 12.6% | 14.9% |
| 1988 | 12.4% | 14.9% |
| 1987 | 12.3% | 14.8% |
| 1986 | 12.1% | 14.6% |
| 1985 | 11.9% | 14.4% |
| 1984 | 11.8% | 14.5% |
| 1983 | 11.8% | 14.8% |
| 1982 | 11.7% | 15.2% |
| 1981 | 11.5% | 15.5% |
| 1980 | 11.4% | 15.7% |
| 1979 | 11.3% | 15.6% |
| 1978 | 11.1% | 15.4% |
| 1977 | 11% | 15.2% |
| 1976 | 10.8% | 15% |
| 1975 | 10.7% | 14.7% |
| 1974 | 10.6% | 14.4% |
| 1973 | 10.4% | 14.2% |
| 1972 | 10.3% | 14% |
| 1971 | 10.2% | 13.8% |
| 1970 | 10.1% | 13.5% |
| 1969 | 10% | 13.4% |
| 1968 | 9.9% | 13.2% |
| 1967 | 9.7% | 12.9% |
| 1966 | 9.6% | 12.6% |
| 1965 | 9.5% | 12.4% |
| 1964 | 9.4% | 12.2% |
| 1963 | 9.3% | 12% |
| 1962 | 9.2% | 11.8% |
| 1961 | 9.1% | 11.5% |
| 1960 | 8.9% | 11.4% |
| 1959 | 8.8% | 11.2% |
| 1958 | 8.7% | 11% |
| 1957 | 8.5% | 10.6% |
| 1956 | 8.4% | 10.4% |
| 1955 | 8.3% | 10.2% |
| 1954 | 8.2% | 10% |
| 1953 | 8.1% | 9.7% |
| 1952 | 7.9% | 9.4% |
| 1951 | 7.8% | 9.1% |
| 1950 | 7.7% | 8.8% |
In 2026, people aged 65 and over make up 21.1% of the Netherlands' population and 24.0% of Germany's: 2.9 percentage points more in Germany. In 1950, the shares were 7.7% in the Netherlands and 8.8% in Germany, 1.1 points more in Germany. By 2100, they are projected to be 32.3% in the Netherlands and 31.2% in Germany, 1.1 points more in the Netherlands.
Germany's share of people aged 65 and over has been higher than the Netherlands' in every year since 1950. The gap was widest in 2009, when Germany's share was 5.6 percentage points above the Netherlands'.
Netherlands vs Germany: share and number of people aged 65+ in 2026
|
Netherlands
|
Germany
|
|
|---|---|---|
| Aged 65+ | 21.1% | 24.0% |
| People aged 65+ | 3.83M | 19.9M |
| Aged 80+ | 5.2% | 7.4% |
| World rank | 25/196 | 7/196 |
| Aged 65+, 2050 projection | 26.2% | 30.3% |
Compare the population aged 65 and over of any 2 countries
Sources:
- United Nations | World Population Prospects (1950–2100, updated October 2026), with adjustments by statistics.wiki to match the latest data
Creative Commons Attribution (CC BY): you may copy, share, adapt and reuse this content, also commercially, as long as you credit statistics.wiki and note any changes you made. The sources listed above may have their own license terms.