
Doctors (physicians) per 1,000 people by country
| Rank | Country | Doctors per 1,000 people | Estimated number |
|---|---|---|---|
 World |
1.86 | 14,800,000 | |
| 1 |  Cuba |
9.54 (2021) | 106,000 |
| 2 |  Monaco |
8.61 (2020) | 328 |
| 3 |  Seychelles |
6.6 | 791 |
| 4 |  Greece |
6.58 | 68,600 |
| 5 |  Portugal |
5.85 | 61,100 |
| 6 |  Georgia |
5.64 (2023) | 21,000 |
| 7 |  Austria |
5.52 (2023) | 50,400 |
| 8 |  Russia |
5.11 | 737,000 |
| 9 |  Argentina |
5.11 (2023) | 233,000 |
| 10 |  Andorra |
5.07 (2023) | 410 |
| 11 |  Norway |
4.97 (2023) | 27,500 |
| 12 |  Belarus |
4.72 (2023) | 43,300 |
| 13 |  Uruguay |
4.67 | 15,800 |
| 14 |  San Marino |
4.63 (2023) | 157 |
| 15 |  Germany |
4.53 | 377,000 |
| 16 |  Malta |
4.51 | 2,400 |
| 17 |  Denmark |
4.5 (2021) | 26,300 |
| 18 |  Switzerland |
4.48 | 39,300 |
| 19 |  Lithuania |
4.47 | 12,600 |
| 20 |  Sweden |
4.41 (2021) | 45,900 |
| 21 |  Iceland |
4.37 (2023) | 1,690 |
| 22 |  Czech Republic |
4.35 | 46,400 |
| 23 |  Bulgaria |
4.33 | 28,000 |
| 24 |  Spain |
4.29 | 205,000 |
| 25 |  Saint Lucia |
4.23 (2020) | 755 |
| 26 |  Italy |
4.19 | 247,000 |
| 27 |  Trinidad |
4.16 (2021) | 5,680 |
| 28 |  Mongolia |
4.13 | 14,200 |
| 29 |  Australia |
4.09 | 106,000 |
| 30 |  Poland |
4.03 (2023) | 148,000 |
| 31 |  Moldova |
4.02 (2023) | 9,870 |
| 32 |  Croatia |
3.91 | 15,100 |
| 33 |  Paraguay |
3.89 | 26,300 |
| 34 |  Netherlands |
3.88 | 68,600 |
| 35 |  Ireland |
3.88 (2023) | 20,600 |
| 36 |  Israel |
3.8 (2023) | 37,400 |
| 37 |  Kazakhstan |
3.75 (2023) | 76,300 |
| 38 |  Slovakia |
3.7 | 20,100 |
| 39 |  United States |
3.68 | 1,230,000 |
| 40 |  North Korea |
3.63 (2017) | 93,700 |
| 41 |  Romania |
3.63 | 69,100 |
| 42 |  New Zealand |
3.61 | 18,400 |
| 43 |  Finland |
3.61 (2021) | 20,000 |
| 44 |  Belgium |
3.57 | 41,700 |
| 45 |  Cyprus |
3.56 | 4,730 |
| 46 |  Ukraine |
3.53 (2023) | 133,000 |
| 47 |  Estonia |
3.47 | 4,680 |
| 48 |  Hungary |
3.46 | 33,200 |
| 49 |  Saudi Arabia |
3.41 (2023) | 115,000 |
| 50 |  Latvia |
3.4 | 6,390 |
| 51 |  Slovenia |
3.37 | 7,110 |
| 52 |  Armenia |
3.36 | 9,980 |
| 53 |  Chile |
3.33 (2023) | 65,500 |
| 54 |  United Kingdom |
3.3 (2023) | 226,000 |
| 55 |  France |
3.28 | 224,000 |
| 56 |  Azerbaijan |
3.19 | 32,300 |
| 57 |  China |
3.11 | 4,390,000 |
| 58 |  Serbia |
3.1 | 20,700 |
| 59 |  Saint Kitts |
3.09 (2018) | 145 |
| 60 |  Qatar |
3.02 (2023) | 8,030 |
| 61 |  UAE |
2.99 (2023) | 31,400 |
| 62 |  Luxembourg |
2.98 (2017) | 1,780 |
| 63 |  Barbados |
2.96 | 835 |
| 64 |  North Macedonia |
2.94 | 5,390 |
| 65 |  Antigua |
2.92 (2017) | 264 |
| 66 |  Jordan |
2.85 | 32,100 |
| 67 |  Singapore |
2.83 | 16,000 |
| 68 |  Canada |
2.82 (2023) | 113,000 |
| 69 |  Uzbekistan |
2.81 (2021) | 96,100 |
| 70 |  Montenegro |
2.78 (2023) | 1,740 |
| 71 |  Costa Rica |
2.69 | 13,700 |
| 72 |  Lebanon |
2.68 (2020) | 15,300 |
| 73 |  Japan |
2.65 | 331,000 |
| 74 |  South Korea |
2.61 | 135,000 |
| 75 |  Mexico |
2.59 | 333,000 |
| 76 |  Bosnia |
2.58 (2019) | 8,640 |
| 77 |  Colombia |
2.54 (2023) | 133,000 |
| 78 |  Dominican Republic |
2.43 (2023) | 27,500 |
| 79 |  Brazil |
2.36 (2023) | 498,000 |
| 80 |  Malaysia |
2.34 (2023) | 82,200 |
| 81 |  Ecuador |
2.31 (2020) | 40,600 |
| 82 |  Kuwait |
2.27 (2020) | 10,000 |
| 83 |  Turkey |
2.24 | 190,000 |
| 84 |  Maldives |
2.24 (2019) | 1,090 |
| 85 |  Palestine |
2.17 (2018) | 9,910 |
| 86 |  Libya |
2.04 (2017) | 13,800 |
| 87 |  Oman |
1.99 | 9,420 |
| 88 |  Turkmenistan |
1.93 (2023) | 14,200 |
| 89 |  Bahamas |
1.9 (2017) | 740 |
| 90 |  Brunei |
1.89 (2021) | 852 |
| 91 |  Albania |
1.88 (2020) | 4,750 |
| 92 |  Tajikistan |
1.87 (2023) | 19,400 |
| 93 |  Iran |
1.81 (2023) | 164,000 |
| 94 |  Palau |
1.81 (2023) | 32 |
| 95 |  Peru |
1.69 (2023) | 57,100 |
| 96 |  Venezuela |
1.66 (2017) | 50,900 |
| 97 |  Algeria |
1.66 | 75,500 |
| 98 |  Panama |
1.63 | 7,150 |
| 99 |  El Salvador |
1.62 (2023) | 10,200 |
| 100 |  Kyrgyzstan |
1.57 (2023) | 11,100 |
| 101 |  Syria |
1.52 (2021) | 32,900 |
| 102 |  Mauritius |
1.44 | 1,810 |
| 103 |  Guyana |
1.39 (2020) | 1,120 |
| 104 |  Grenada |
1.38 (2018) | 160 |
| 105 |  Suriname |
1.36 (2023) | 852 |
| 106 |  Tuvalu |
1.35 (2020) | 14 |
| 107 |  Tunisia |
1.32 (2021) | 15,800 |
| 108 |  Bolivia |
1.28 (2021) | 15,300 |
| 109 |  Guatemala |
1.28 (2020) | 22,200 |
| 110 |  Nauru |
1.27 (2015) | 14 |
| 111 |  Pakistan |
1.16 (2021) | 278,000 |
| 112 |  Dominica |
1.16 (2018) | 79 |
| 113 |  Sri Lanka |
1.14 (2023) | 25,000 |
| 114 |  Vietnam |
1.11 (2021) | 110,000 |
| 115 |  Belize |
1.09 (2018) | 413 |
| 116 |  Iraq |
1.02 | 45,000 |
| 117 |  Tonga |
1.01 (2021) | 107 |
| 118 |  Nepal |
1.01 (2023) | 30,000 |
| 119 |  Fiji |
0.81 (2015) | 747 |
| 120 |  South Africa |
0.79 | 49,500 |
| 121 |  Philippines |
0.79 (2021) | 89,600 |
| 122 |  Myanmar |
0.76 (2019) | 39,800 |
| 123 |  East Timor |
0.75 (2020) | 997 |
| 124 |  Bahrain |
0.74 (2020) | 1,090 |
| 125 |  Morocco |
0.74 (2021) | 27,300 |
| 126 |  Cape Verde |
0.73 (2023) | 381 |
| 127 |  India |
0.72 (2020) | 1,010,000 |
| 128 |  Bangladesh |
0.72 (2023) | 124,000 |
| 129 |  Nicaragua |
0.68 (2018) | 4,360 |
| 130 |  Egypt |
0.67 (2020) | 73,400 |
| 131 |  Samoa |
0.56 (2021) | 120 |
| 132 |  Eswatini |
0.56 (2023) | 685 |
| 133 |  Bhutan |
0.55 | 432 |
| 133 |  Namibia |
0.55 | 1,600 |
| 135 |  Thailand |
0.54 (2021) | 38,800 |
| 136 |  Indonesia |
0.52 (2023) | 147,000 |
| 137 |  Gabon |
0.52 | 1,270 |
| 138 |  Honduras |
0.49 (2020) | 4,950 |
| 139 |  Sao Tome |
0.46 | 105 |
| 140 |  Jamaica |
0.46 (2023) | 1,310 |
| 141 |  Comoros |
0.42 | 354 |
| 142 |  Nigeria |
0.38 (2023) | 86,600 |
| 143 |  Botswana |
0.38 (2023) | 940 |
| 144 |  Laos |
0.33 | 2,500 |
| 145 |  Zambia |
0.32 | 6,530 |
| 146 |  Afghanistan |
0.32 (2023) | 13,100 |
| 147 |  Haiti |
0.29 | 3,360 |
| 148 |  Kenya |
0.29 (2023) | 16,000 |
| 149 |  Ghana |
0.27 (2023) | 8,990 |
| 150 |  Mauritania |
0.26 | 1,270 |
| 151 |  Guinea-Bissau |
0.25 | 531 |
| 152 |  Sudan |
0.25 (2017) | 10,700 |
| 153 |  Angola |
0.24 | 8,690 |
| 154 |  Solomon Islands |
0.24 (2023) | 190 |
| 155 |  Lesotho |
0.24 | 537 |
| 156 |  Benin |
0.22 (2023) | 3,050 |
| 157 |  Cambodia |
0.21 (2019) | 3,480 |
| 157 |  Djibouti |
0.21 | 240 |
| 159 |  Guinea |
0.21 | 2,950 |
| 160 |  DR Congo |
0.21 | 21,300 |
| 161 |  Kiribati |
0.19 (2013) | 22 |
| 162 |  Uganda |
0.19 | 9,040 |
| 163 |  Mali |
0.19 (2023) | 4,470 |
| 164 |  Liberia |
0.18 | 956 |
| 165 |  Mozambique |
0.18 | 5,710 |
| 166 |  Congo |
0.17 | 1,040 |
| 167 |  Madagascar |
0.17 | 5,240 |
| 168 |  Ivory Coast |
0.17 (2023) | 5,170 |
| 169 |  Vanuatu |
0.16 (2019) | 48 |
| 170 |  Equatorial Guinea |
0.15 | 276 |
| 171 |  Burkina Faso |
0.15 | 3,330 |
| 172 |  Ethiopia |
0.14 (2023) | 18,400 |
| 173 |  Cameroon |
0.14 | 3,760 |
| 173 |  Zimbabwe |
0.14 (2023) | 2,220 |
| 175 |  Sierra Leone |
0.13 | 1,110 |
| 175 |  Tanzania |
0.13 | 8,670 |
| 177 |  Senegal |
0.11 (2023) | 1,970 |
| 178 |  Yemen |
0.1 (2023) | 3,860 |
| 179 |  Gambia |
0.09 (2023) | 243 |
| 179 |  Rwanda |
0.09 | 1,230 |
| 181 |  Eritrea |
0.09 | 300 |
| 182 |  Chad |
0.09 (2023) | 1,640 |
| 183 |  Togo |
0.08 | 645 |
| 184 |  Burundi |
0.08 | 1,040 |
| 185 |  CAR |
0.07 (2023) | 381 |
| 186 |  Papua New Guinea |
0.06 (2023) | 634 |
| 187 |  Malawi |
0.05 | 1,110 |
| 188 |  Somalia |
0.05 (2014) | 640 |
| 189 |  South Sudan |
0.04 | 452 |
| 190 |  Niger |
0.04 (2023) | 994 |
| Not ranked: latest data before 2013 | |||
 Cayman Islands |
1.94 (1997) | 69 | |
 Saint Vincent |
0.94 (2012) | 102 | |
 Marshall Islands |
0.47 (2012) | 24 | |
Of the 190 countries in the table, the latest number of doctors per 1,000 people is highest in Cuba, 9.54 (2021), and lowest in Niger, 0.04. In half of them it is below 1.68. The world as a whole has 1.86 doctors per 1,000 people, about 14.8 million doctors in all.
This measure counts the medical doctors, general practitioners and specialists alike, who work in a country for every 1,000 of its inhabitants. The World Health Organization collects the numbers from national reports. Countries report in different years, so the table gives each country's latest year; the estimated number of doctors applies that rate to the population of the same year.
Doctors per 1,000 people map (latest data)
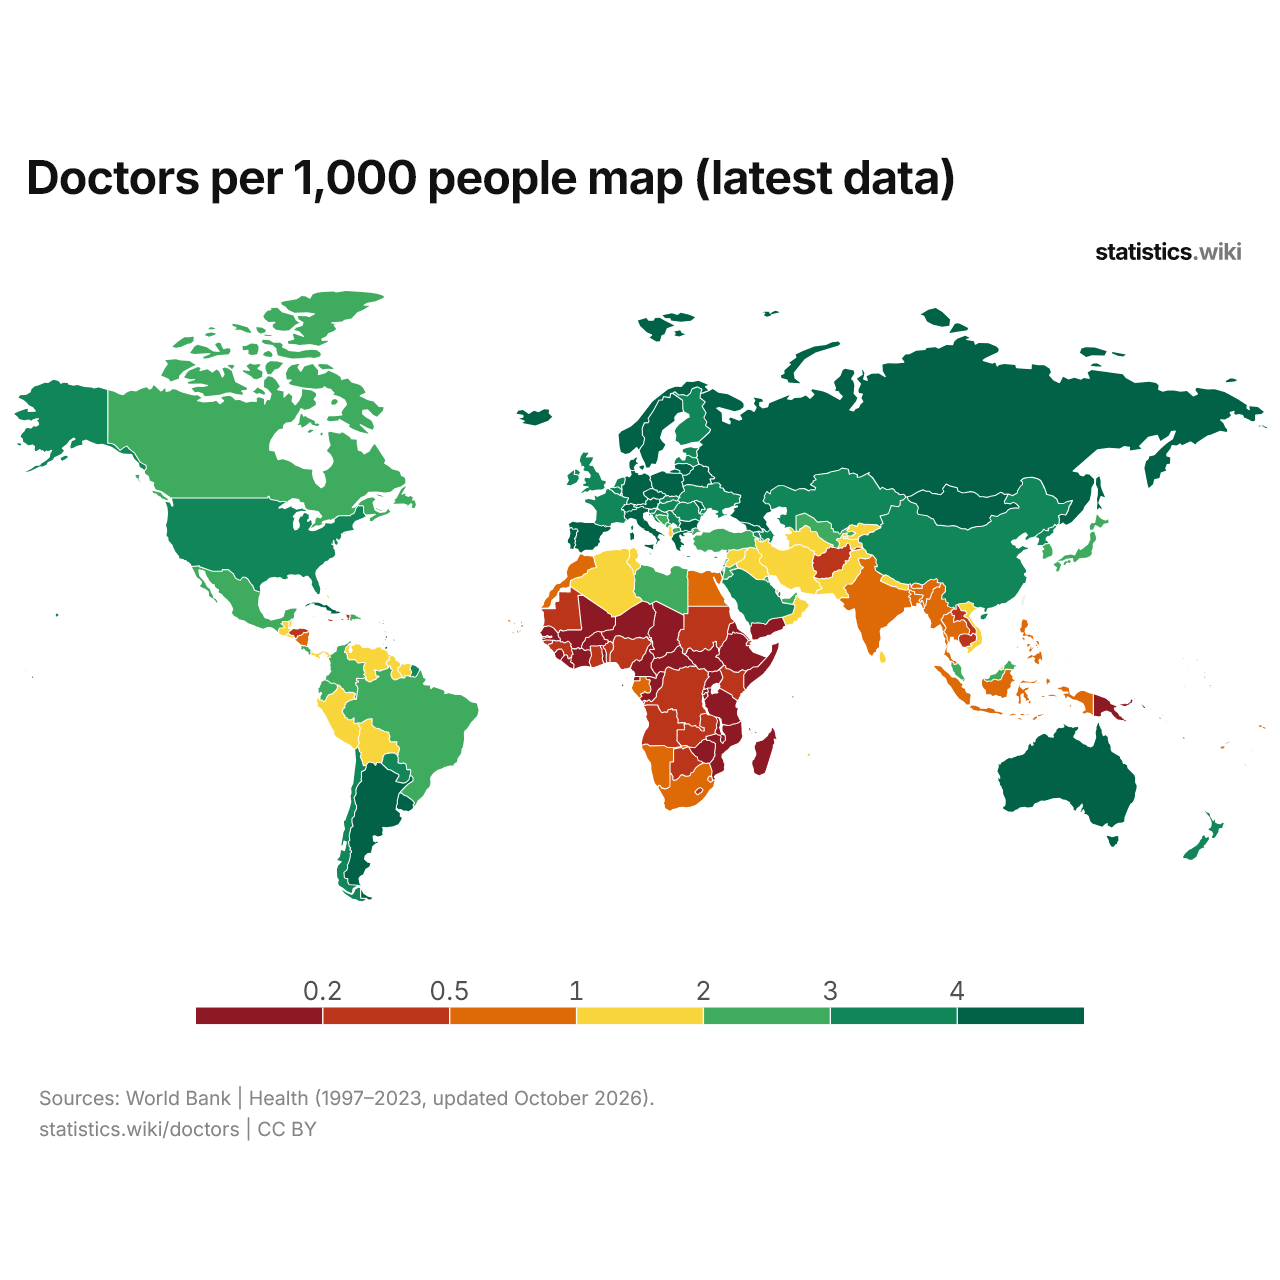
Of the 193 countries on the map, 31 have more than 4 doctors per 1,000 people and 74 have fewer than 1.
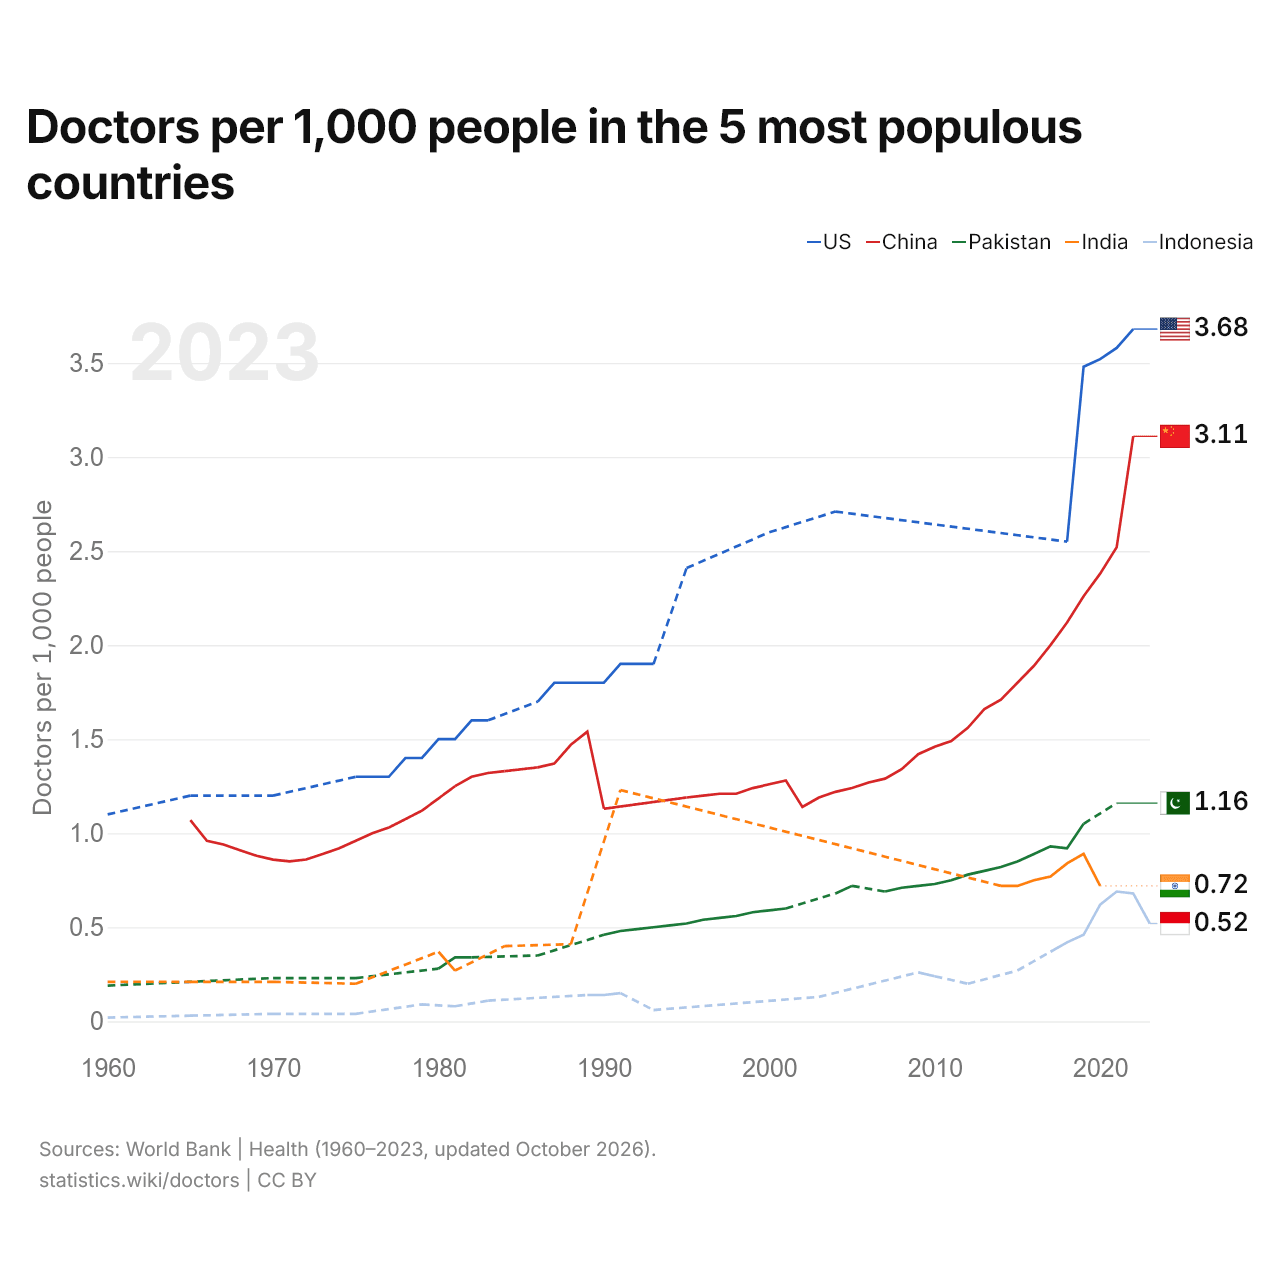
Doctors per 1,000 people in the 5 most populous countries
| Year | Doctors per 1,000 people | ||||
|---|---|---|---|---|---|
| United States | China | Pakistan | India | Indonesia | |
| 2023 | - | - | - | - | 0.52 |
| 2022 | 3.68 | 3.11 | - | - | 0.68 |
| 2021 | 3.58 | 2.52 | 1.16 | - | 0.69 |
| 2020 | 3.52 | 2.38 | - | 0.72 | 0.62 |
| 2019 | 3.48 | 2.26 | 1.05 | 0.89 | 0.46 |
| 2018 | 2.55 | 2.12 | 0.92 | 0.84 | 0.42 |
| 2017 | - | 2 | 0.93 | 0.77 | 0.37 |
| 2016 | - | 1.89 | 0.89 | 0.75 | - |
| 2015 | - | 1.8 | 0.85 | 0.72 | 0.27 |
| 2014 | - | 1.71 | 0.82 | 0.72 | - |
| 2013 | - | 1.66 | 0.8 | - | - |
| 2012 | - | 1.56 | 0.78 | - | 0.2 |
| 2011 | - | 1.49 | 0.75 | - | - |
| 2010 | - | 1.46 | 0.73 | - | 0.24 |
| 2009 | - | 1.42 | 0.72 | - | 0.26 |
| 2008 | - | 1.34 | 0.71 | - | - |
| 2007 | - | 1.29 | 0.69 | - | - |
| 2006 | - | 1.27 | - | - | - |
| 2005 | - | 1.24 | 0.72 | - | - |
| 2004 | 2.71 | 1.22 | 0.68 | - | - |
| 2003 | - | 1.19 | - | - | 0.13 |
| 2002 | - | 1.14 | - | - | - |
| 2001 | - | 1.28 | 0.6 | - | - |
| 2000 | 2.6 | 1.26 | 0.59 | - | - |
| 1999 | - | 1.24 | 0.58 | - | - |
| 1998 | - | 1.21 | 0.56 | - | - |
| 1997 | - | 1.21 | 0.55 | - | - |
| 1996 | - | 1.2 | 0.54 | - | - |
| 1995 | 2.41 | 1.19 | 0.52 | - | - |
| 1994 | - | - | 0.51 | - | - |
| 1993 | 1.9 | - | 0.5 | - | 0.06 |
| 1992 | 1.9 | - | 0.49 | - | - |
| 1991 | 1.9 | - | 0.48 | 1.23 | 0.15 |
| 1990 | 1.8 | 1.13 | 0.46 | - | 0.14 |
| 1989 | 1.8 | 1.54 | - | - | 0.14 |
| 1988 | 1.8 | 1.47 | - | 0.41 | - |
| 1987 | 1.8 | 1.37 | - | - | - |
| 1986 | 1.7 | 1.35 | 0.35 | - | - |
| 1984 | - | 1.33 | - | 0.4 | - |
| 1983 | 1.6 | 1.32 | - | - | 0.11 |
| 1982 | 1.6 | 1.3 | 0.34 | - | - |
| 1981 | 1.5 | 1.25 | 0.34 | 0.27 | 0.08 |
| 1980 | 1.5 | - | 0.28 | 0.37 | - |
| 1979 | 1.4 | 1.12 | - | - | 0.09 |
| 1978 | 1.4 | - | - | - | - |
| 1977 | 1.3 | 1.03 | - | - | - |
| 1976 | 1.3 | 1 | - | - | - |
| 1975 | 1.3 | 0.96 | 0.23 | 0.2 | 0.04 |
| 1974 | - | 0.92 | - | - | - |
| 1973 | - | 0.89 | - | - | - |
| 1972 | - | 0.86 | - | - | - |
| 1971 | - | 0.85 | - | - | - |
| 1970 | 1.2 | 0.86 | 0.23 | 0.21 | 0.04 |
| 1969 | - | 0.88 | - | - | - |
| 1968 | - | 0.91 | - | - | - |
| 1967 | - | 0.94 | - | - | - |
| 1966 | - | 0.96 | - | - | - |
| 1965 | 1.2 | 1.07 | - | 0.21 | 0.03 |
| 1960 | 1.1 | - | 0.19 | 0.21 | 0.02 |
Among the five most populous countries, the latest number of doctors per 1,000 people is highest in the United States, 3.68, and lowest in Indonesia, 0.52. The largest change is in the United States, where the number has risen from 1.1 in 1960 to 3.68.
Compare the doctors per capita of any 2 countries
Sources:
- World Bank | Health (1960–2023, updated October 2026)
- U.S. Census Bureau (2022, updated October 2026)
- Central Intelligence Agency (CIA) (2022, updated October 2026)
- National Statistics, Taiwan (2022, updated October 2026)
Creative Commons Attribution (CC BY): you may copy, share, adapt and reuse this content, also commercially, as long as you credit statistics.wiki and note any changes you made. The sources listed above may have their own license terms.